## Line Chart: 10x10 Maze: L-ICL Performance Across LLMs
### Overview
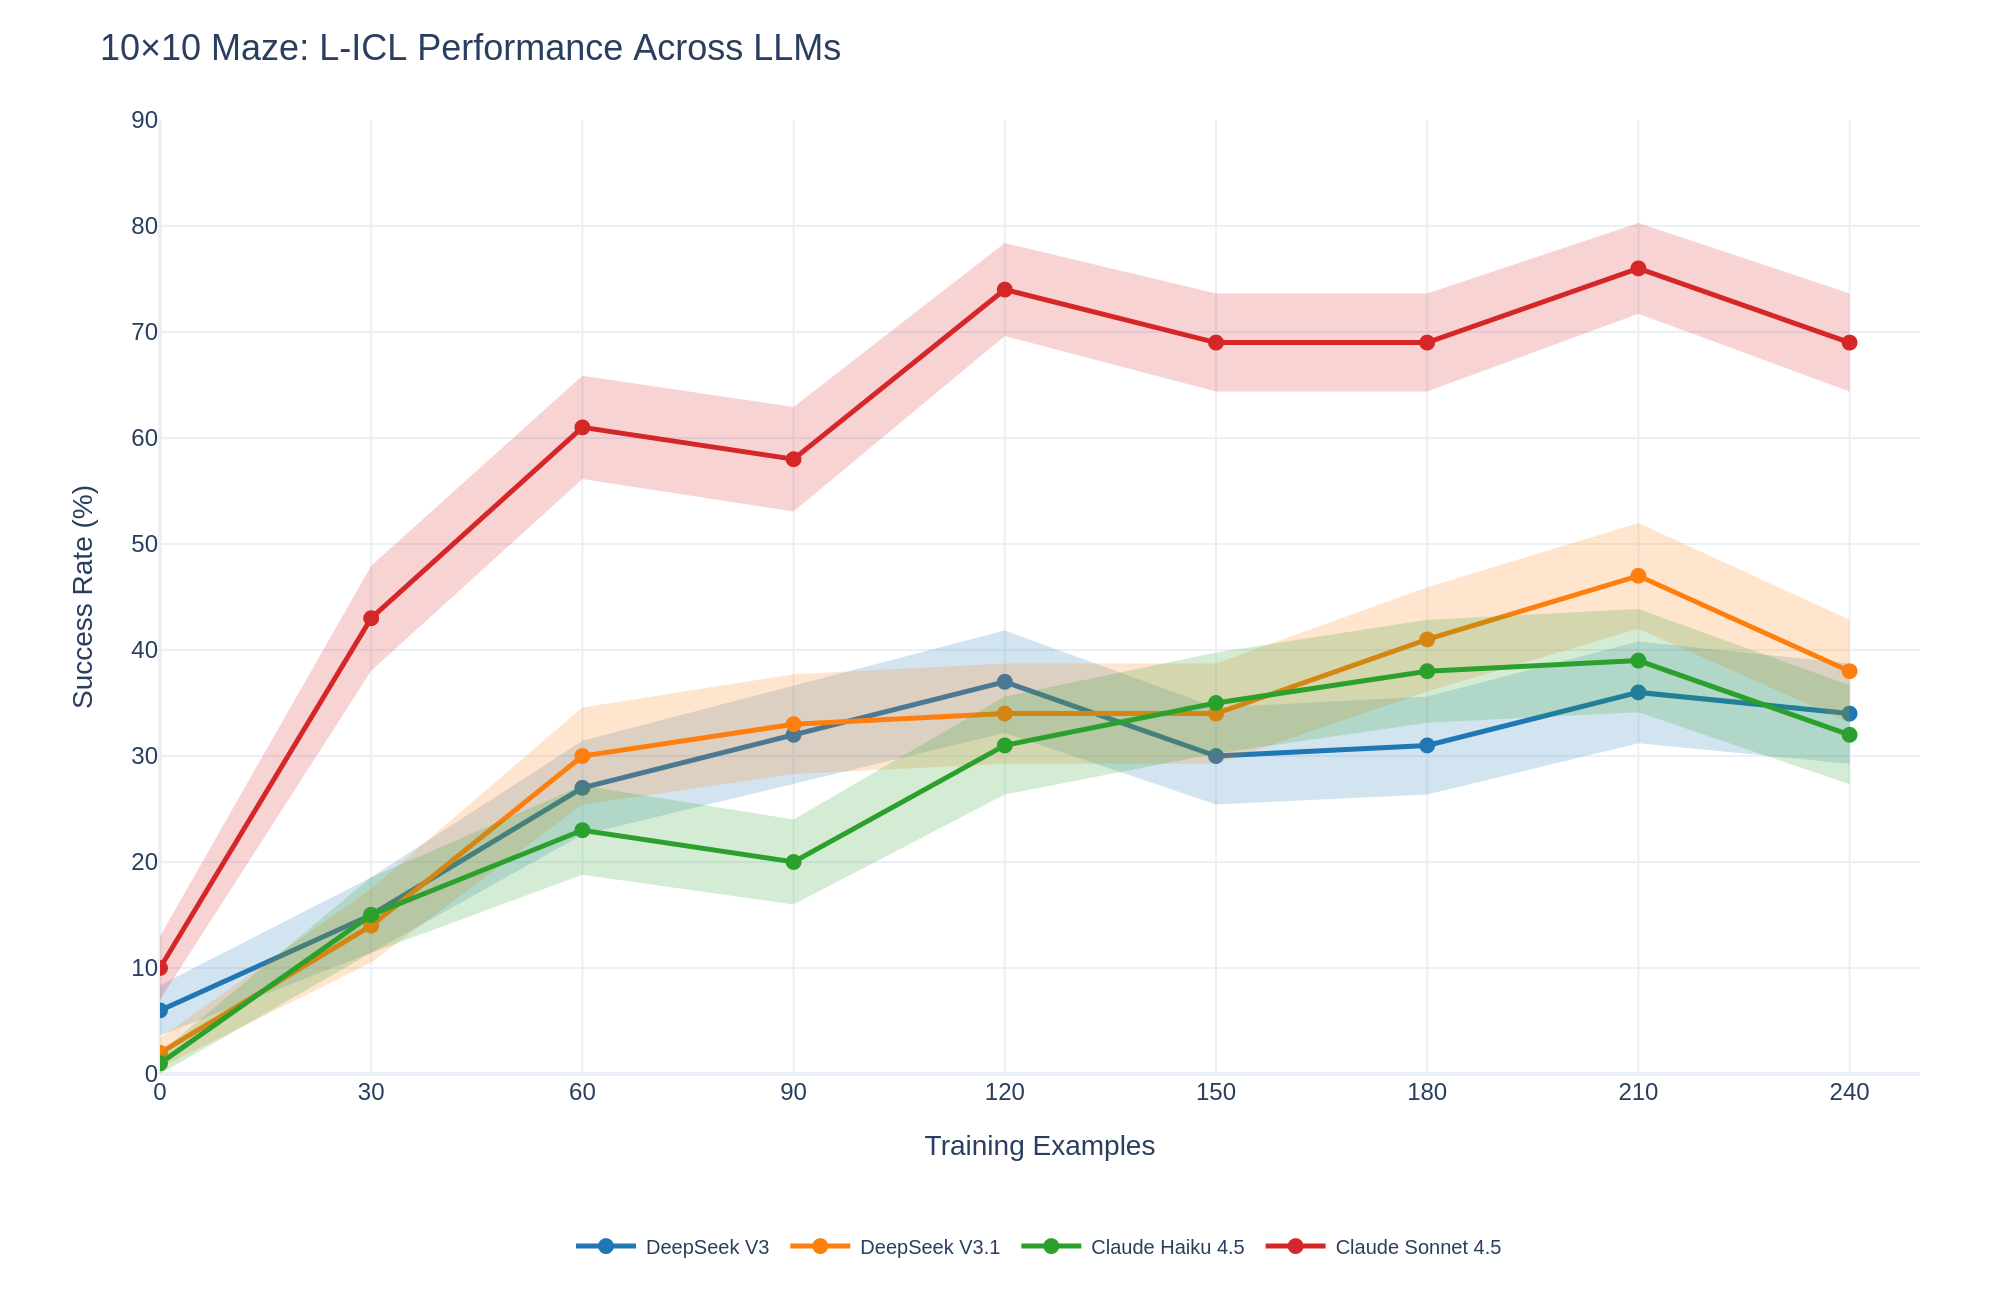
This line chart displays the success rate (%) of several Large Language Models (LLMs) on a 10x10 maze task, as a function of the number of training examples provided. The chart compares the performance of DeepSeek V3, DeepSeek V3.1, Claude Haiku 4.5, and Claude Sonnet 4.5. The x-axis represents the number of training examples, and the y-axis represents the success rate. Shaded areas around each line indicate confidence intervals or standard deviations.
### Components/Axes
* **Title:** 10x10 Maze: L-ICL Performance Across LLMs
* **X-axis Label:** Training Examples (ranging from 0 to 240, with increments of 30)
* **Y-axis Label:** Success Rate (%) (ranging from 0 to 90, with increments of 10)
* **Legend:** Located at the bottom of the chart, identifying each line by LLM name and color.
* DeepSeek V3 (Blue)
* DeepSeek V3.1 (Orange)
* Claude Haiku 4.5 (Green)
* Claude Sonnet 4.5 (Red)
### Detailed Analysis
The chart shows the success rate of each LLM as a function of training examples.
* **DeepSeek V3 (Blue):** The line starts at approximately 10% at 0 training examples, rises sharply to around 30% at 60 training examples, plateaus around 30-35% between 60 and 180 training examples, and then declines slightly to approximately 30% at 240 training examples.
* **DeepSeek V3.1 (Orange):** The line begins at approximately 10% at 0 training examples, increases steadily to around 40% at 90 training examples, fluctuates between 35% and 45% from 90 to 210 training examples, and then decreases to approximately 35% at 240 training examples. The shaded area around this line is quite large, indicating high variability.
* **Claude Haiku 4.5 (Green):** The line starts at approximately 10% at 0 training examples, rises to around 25% at 60 training examples, plateaus around 30-35% between 60 and 180 training examples, and then increases to approximately 40% at 240 training examples.
* **Claude Sonnet 4.5 (Red):** The line begins at approximately 10% at 0 training examples, increases rapidly to around 70% at 90 training examples, reaches a peak of approximately 75% at 120 training examples, and then declines gradually to approximately 65% at 240 training examples.
### Key Observations
* Claude Sonnet 4.5 consistently outperforms the other LLMs, especially in the range of 0-120 training examples.
* DeepSeek V3 and Claude Haiku 4.5 show similar performance, with relatively stable success rates after an initial increase.
* DeepSeek V3.1 exhibits the highest variability in performance, as indicated by the large shaded area around its line.
* All LLMs show an initial increase in success rate with more training examples, but the rate of improvement diminishes as the number of examples increases.
* After a certain point, increasing the number of training examples does not necessarily lead to a higher success rate, and in some cases, can even lead to a decrease.
### Interpretation
The data suggests that the choice of LLM significantly impacts performance on the 10x10 maze task. Claude Sonnet 4.5 demonstrates superior learning capabilities, achieving a high success rate with a relatively small number of training examples. The diminishing returns observed with increasing training examples indicate that the LLMs may reach a point of saturation, where additional examples do not provide significant improvements. The variability in DeepSeek V3.1's performance suggests that its learning process may be more sensitive to the specific training data or initialization conditions. The chart highlights the importance of selecting an appropriate LLM and optimizing the training data to maximize performance on a given task. The initial rapid increase in success rate for all models suggests that even a small amount of task-specific training can significantly improve performance. The subsequent plateau and decline in some cases suggest that overfitting or the limitations of the model architecture may be factors.