## Line Chart: 10×10 Maze: L-ICL Performance Across LLMs
### Overview
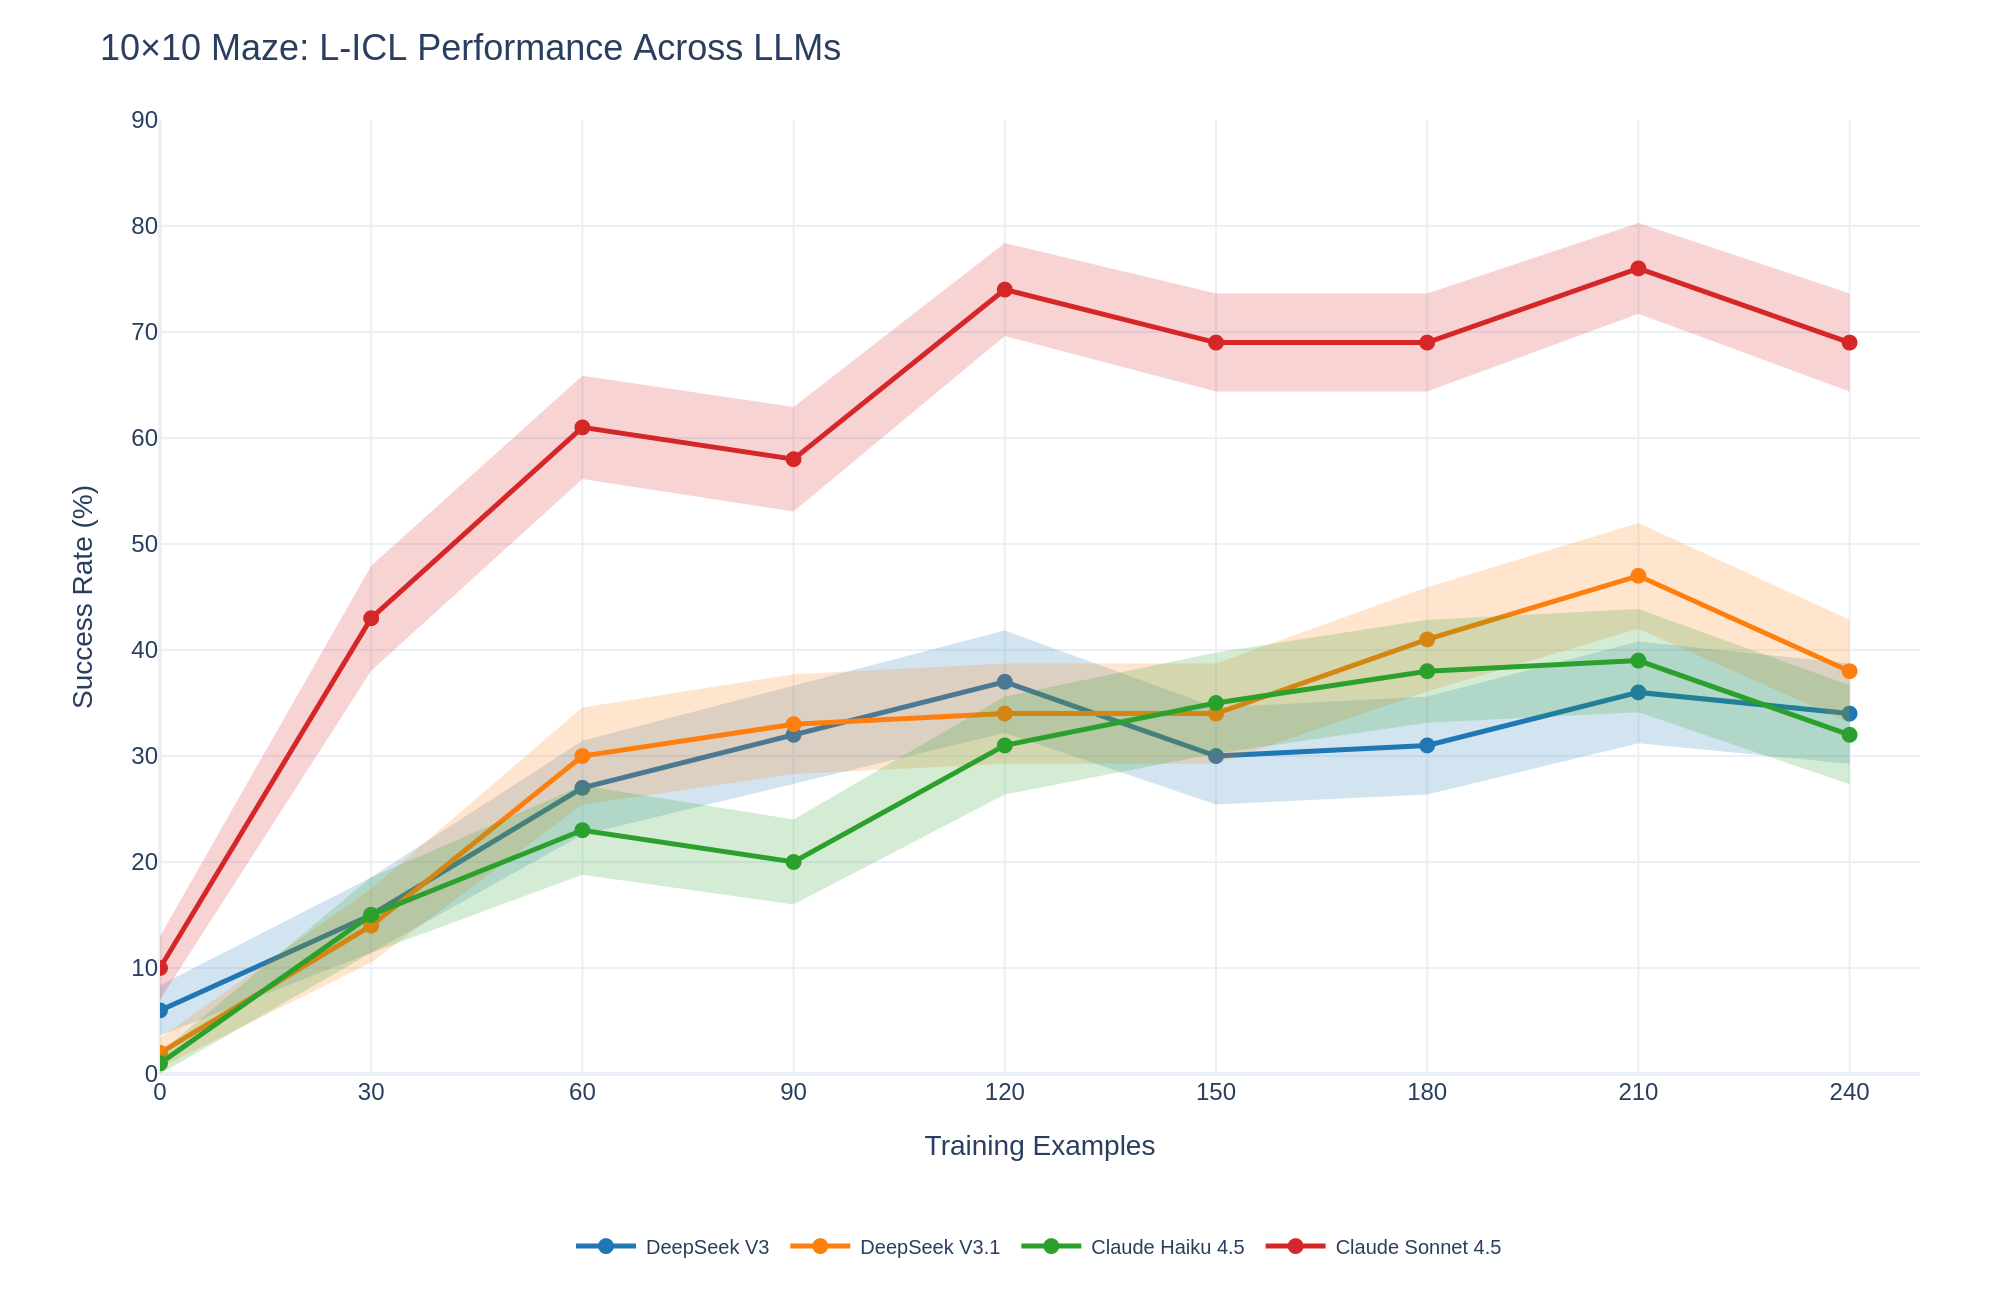
This is a line chart comparing the performance of four Large Language Models (LLMs) on a 10×10 maze-solving task using Learning from In-Context Examples (L-ICL). The chart plots the success rate percentage against the number of training examples provided. Each model's performance is represented by a colored line with markers, accompanied by a shaded region indicating variability or confidence intervals.
### Components/Axes
* **Title:** "10×10 Maze: L-ICL Performance Across LLMs" (Top-left corner).
* **Y-Axis:** Labeled "Success Rate (%)". Scale ranges from 0 to 90, with major gridlines at intervals of 10.
* **X-Axis:** Labeled "Training Examples". Scale shows discrete points at 0, 30, 60, 90, 120, 150, 180, 210, and 240.
* **Legend:** Located at the bottom center of the chart. It maps line colors and markers to model names:
* **Blue line with circle markers:** DeepSeek V3
* **Orange line with circle markers:** DeepSeek V3.1
* **Green line with circle markers:** Claude Haiku 4.5
* **Red line with circle markers:** Claude Sonnet 4.5
* **Data Series:** Four lines, each with a shaded band of the same color representing the range of performance (likely standard deviation or confidence interval).
### Detailed Analysis
**Trend Verification & Data Point Extraction (Approximate Values):**
1. **Claude Sonnet 4.5 (Red Line):**
* **Trend:** Shows the steepest initial improvement and maintains the highest performance throughout. The trend is strongly upward from 0 to 120 examples, followed by a plateau with minor fluctuations.
* **Data Points:** 0 examples: ~10% | 30: ~43% | 60: ~61% | 90: ~58% | 120: ~74% | 150: ~69% | 180: ~69% | 210: ~76% | 240: ~69%.
2. **DeepSeek V3.1 (Orange Line):**
* **Trend:** Shows steady improvement, peaking at 210 examples before a decline. It generally performs second-best after the initial training phase.
* **Data Points:** 0 examples: ~2% | 30: ~14% | 60: ~30% | 90: ~33% | 120: ~34% | 150: ~34% | 180: ~41% | 210: ~47% | 240: ~38%.
3. **DeepSeek V3 (Blue Line):**
* **Trend:** Improves until 120 examples, experiences a notable dip at 150, then recovers slowly. It ends with performance similar to Claude Haiku 4.5.
* **Data Points:** 0 examples: ~6% | 30: ~15% | 60: ~27% | 90: ~32% | 120: ~37% | 150: ~30% | 180: ~31% | 210: ~36% | 240: ~34%.
4. **Claude Haiku 4.5 (Green Line):**
* **Trend:** Shows a general upward trend with a slight dip at 90 examples. It closely tracks DeepSeek V3 in the later stages.
* **Data Points:** 0 examples: ~1% | 30: ~15% | 60: ~23% | 90: ~20% | 120: ~31% | 150: ~35% | 180: ~38% | 210: ~39% | 240: ~32%.
**Spatial Grounding & Variability:**
* The shaded confidence bands are widest for Claude Sonnet 4.5, indicating higher variance in its performance across different runs or samples.
* The bands for the other three models are narrower and overlap significantly between 30 and 120 training examples, suggesting similar performance uncertainty in that range.
* At 240 examples, the performance of all models except Claude Sonnet 4.5 converges within a ~6% range (approximately 32%-38%).
### Key Observations
1. **Dominant Performance:** Claude Sonnet 4.5 is the clear top performer, achieving a success rate over 20 percentage points higher than the next best model at its peak (120 examples).
2. **Learning Curves:** All models benefit from increased training examples, but the rate of improvement (slope) is most dramatic for Claude Sonnet 4.5 between 0 and 60 examples.
3. **Performance Plateaus/Dips:** Several models show performance dips or plateaus (e.g., Claude Sonnet at 90 & 150, DeepSeek V3 at 150, Claude Haiku at 90). This could indicate points where additional examples temporarily confuse the model or where the task complexity interacts with the model's learning capacity.
4. **Final Convergence:** By 240 examples, the performance gap between the three lower-performing models narrows considerably, while Claude Sonnet 4.5 remains in a distinctly higher tier.
### Interpretation
The data demonstrates a significant disparity in the in-context learning capabilities of the tested LLMs for a spatial reasoning task (maze solving). **Claude Sonnet 4.5 exhibits a superior ability to leverage provided examples to solve novel mazes**, suggesting a more robust internal representation or more effective learning algorithm for this type of problem.
The general upward trend for all models confirms the efficacy of the L-ICL approach—more examples lead to better performance. However, the non-monotonic curves (dips and plateaus) are critical findings. They suggest that learning is not linear and that there may be "confusion points" where the model's hypothesis space becomes too complex or where it overfits to certain example patterns before generalizing better with even more data.
The narrower confidence intervals for DeepSeek models and Claude Haiku might indicate more consistent, if lower-ceiling, performance. In contrast, Claude Sonnet 4.5's wider bands suggest higher potential reward but also higher variability, which could be important for reliability-critical applications.
**In summary, this chart provides strong evidence that model architecture or training methodology has a profound impact on few-shot learning performance for spatial tasks, with Claude Sonnet 4.5 being the most effective learner in this specific benchmark.**