## Line Chart: 10x10 Maze: L-ICL Performance Across LLMs
### Overview
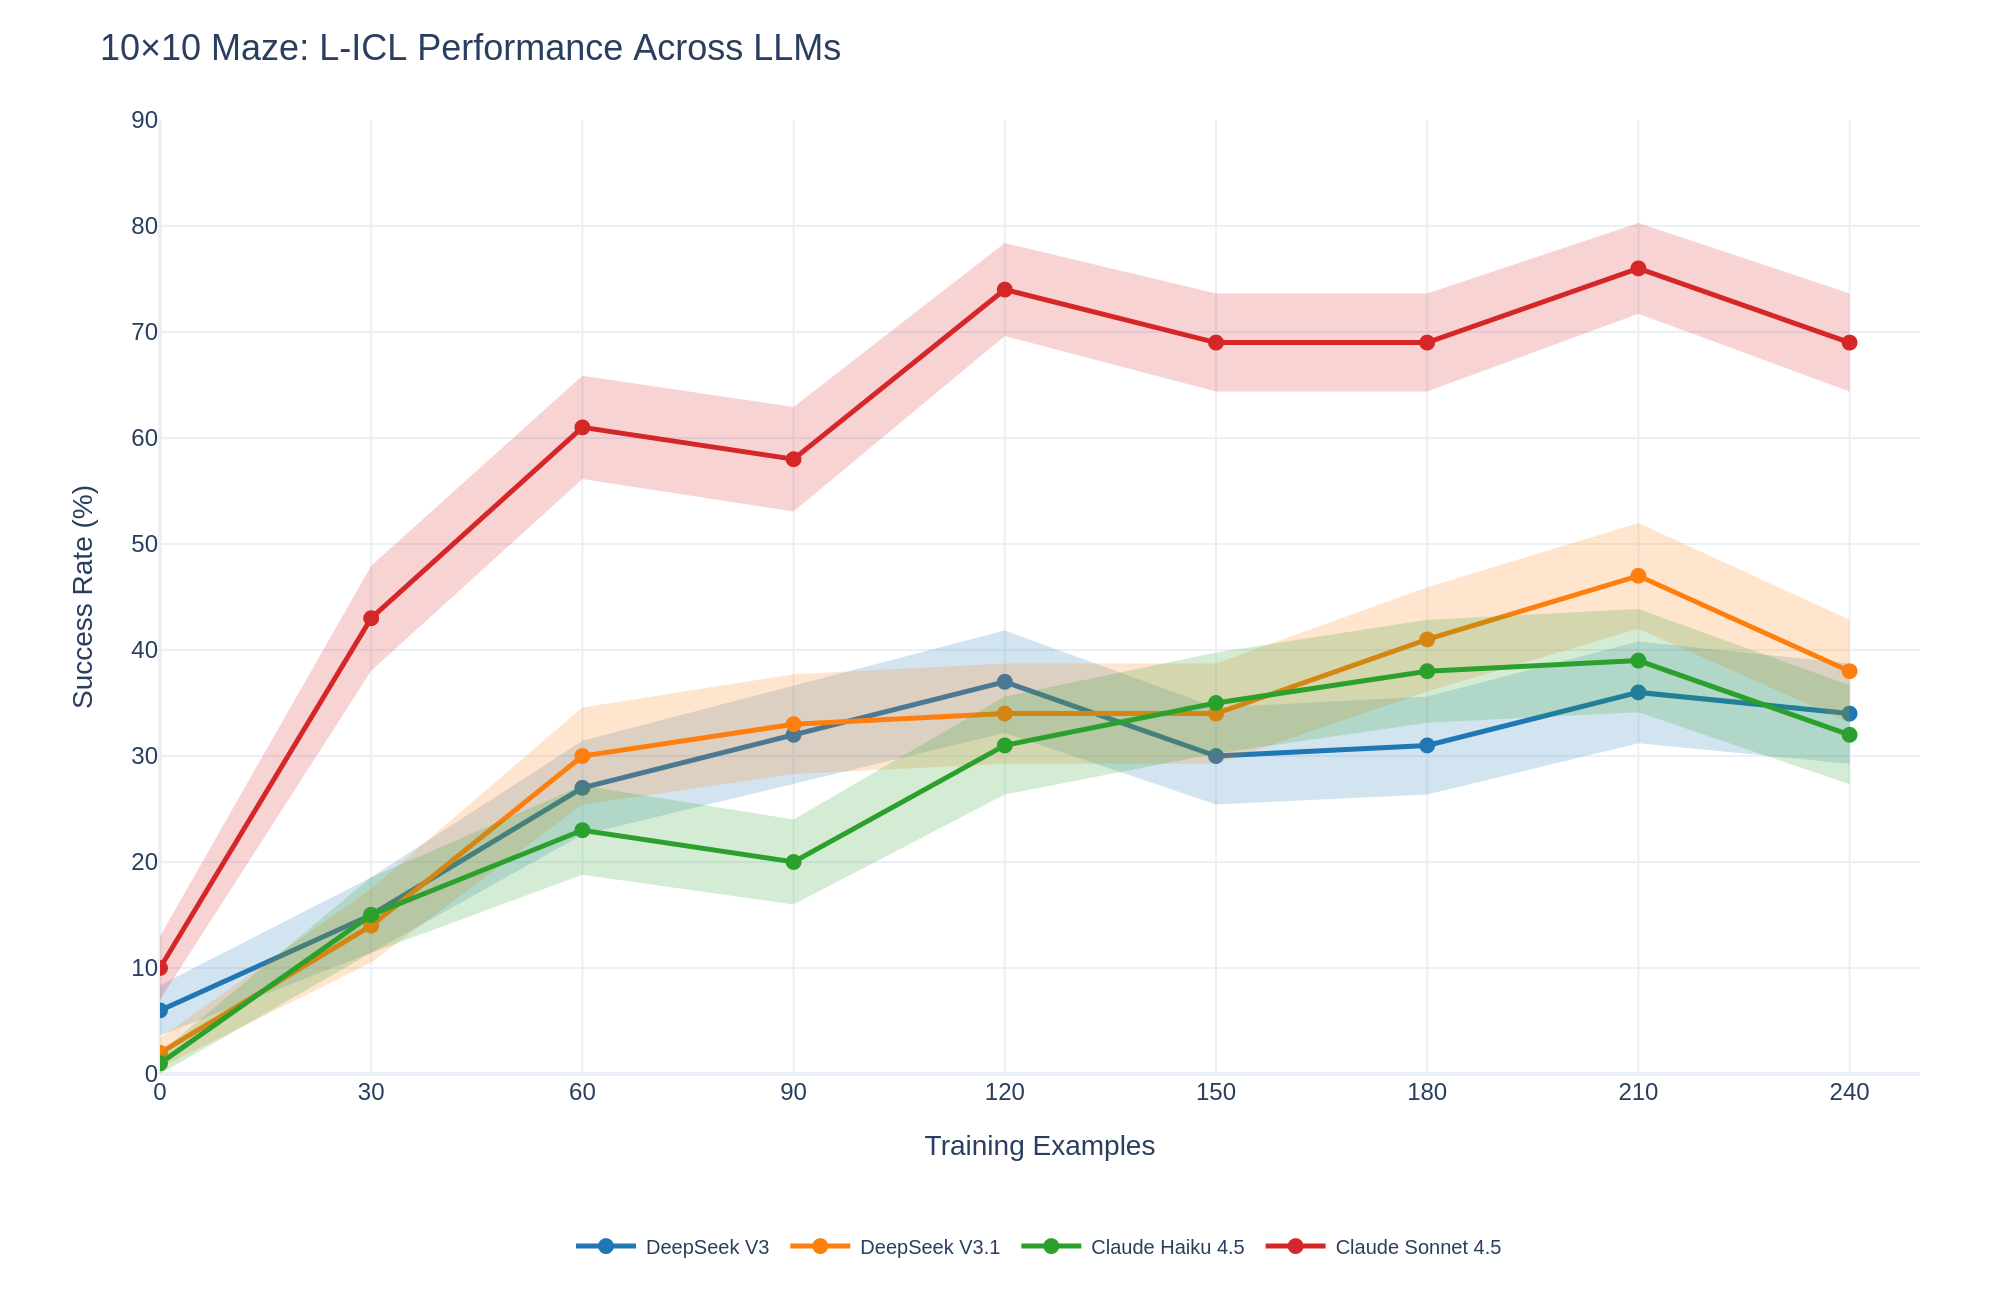
The chart visualizes the success rate (%) of four large language models (LLMs) across varying numbers of training examples (0–240) in a 10x10 maze task. Success rates are plotted with shaded confidence intervals (likely ±1–2 standard deviations). The models compared are DeepSeek V3 (blue), DeepSeek V3.1 (orange), Claude Haiku 4.5 (green), and Claude Sonnet 4.5 (red).
### Components/Axes
- **X-axis**: Training Examples (0, 30, 60, 90, 120, 150, 180, 210, 240)
- **Y-axis**: Success Rate (%) (0–90)
- **Legend**: Located at the bottom center, mapping colors to models:
- Blue: DeepSeek V3
- Orange: DeepSeek V3.1
- Green: Claude Haiku 4.5
- Red: Claude Sonnet 4.5
### Detailed Analysis
1. **Claude Sonnet 4.5 (Red Line)**:
- Starts at ~10% success rate at 0 examples.
- Peaks at ~75% at 210 examples, with a slight decline to ~70% at 240.
- Shaded area widens significantly after 120 examples, indicating higher variability.
2. **DeepSeek V3.1 (Orange Line)**:
- Begins at ~5% at 0 examples.
- Rises steadily to ~45% at 210 examples, then dips to ~35% at 240.
- Shaded area remains relatively narrow, suggesting consistent performance.
3. **Claude Haiku 4.5 (Green Line)**:
- Starts at ~1% at 0 examples.
- Peaks at ~35% at 180 examples, then declines to ~30% at 240.
- Shaded area broadens after 150 examples.
4. **DeepSeek V3 (Blue Line)**:
- Begins at ~5% at 0 examples.
- Peaks at ~35% at 120 examples, then declines to ~30% at 240.
- Shaded area is narrowest overall, indicating stable performance.
### Key Observations
- **Claude Sonnet 4.5** dominates performance, achieving the highest success rates across all training scales.
- **DeepSeek V3.1** shows the most dramatic improvement with training, surpassing other models after 120 examples.
- **Claude Haiku 4.5** and **DeepSeek V3** exhibit diminishing returns after ~150–180 examples.
- All models show initial rapid gains, followed by plateauing or slight declines at higher training scales.
### Interpretation
The data suggests that **Claude Sonnet 4.5** is the most robust model for this task, maintaining high success rates even with limited training. **DeepSeek V3.1** demonstrates strong scalability, outperforming others at higher training volumes. The shaded areas highlight that **Claude Sonnet 4.5** has the highest variability, possibly due to complex decision-making in the maze. The decline in performance for some models at 240 examples may indicate overfitting or task-specific limitations. Notably, **DeepSeek V3.1**’s peak at 210 examples aligns with its narrowest confidence interval, suggesting optimal training efficiency.