## Scatter Plot Grid: LLM Behavior Analysis Across Layers and Behavior Coefficients
### Overview
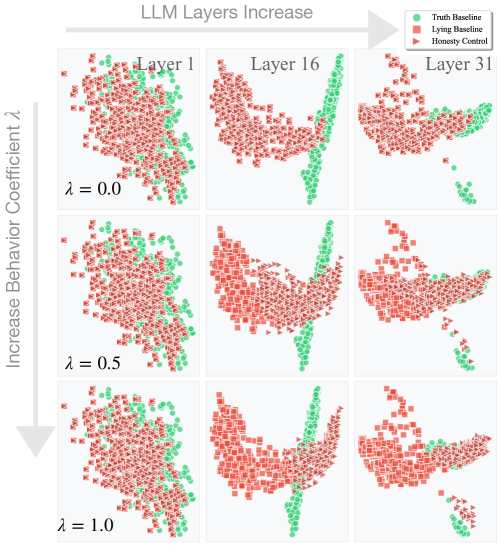
The image presents a 3x3 grid of scatter plots visualizing the behavior of a Large Language Model (LLM) across different layers (1, 16, and 31) and with varying behavior coefficients (λ = 0.0, 0.5, and 1.0). Each scatter plot displays three data series: "Truth Baseline" (green circles), "Lying Baseline" (red squares), and "Honesty Control" (red triangles). The plots aim to illustrate how the model's behavior shifts from truthfulness to lying as the layers increase and the behavior coefficient changes.
### Components/Axes
* **Title:** LLM Layers Increase (horizontal arrow indicating direction of increase)
* **Y-Axis Label:** Increase Behavior Coefficient λ (vertical arrow indicating direction of increase)
* **X-Axis:** LLM Layers (Layer 1, Layer 16, Layer 31)
* **Y-Axis:** Behavior Coefficient λ (λ = 0.0, λ = 0.5, λ = 1.0)
* **Legend (Top-Right):**
* Green Circles: Truth Baseline
* Red Squares: Lying Baseline
* Red Triangles: Honesty Control
### Detailed Analysis
The grid is structured as follows:
| | Layer 1 | Layer 16 | Layer 31 |
| :-------------------- | :------------------------------------ | :------------------------------------ | :------------------------------------ |
| **λ = 0.0** | Scatter plot with green circles and red shapes | Scatter plot with green circles and red shapes | Scatter plot with green circles and red shapes |
| **λ = 0.5** | Scatter plot with green circles and red shapes | Scatter plot with green circles and red shapes | Scatter plot with green circles and red shapes |
| **λ = 1.0** | Scatter plot with green circles and red shapes | Scatter plot with green circles and red shapes | Scatter plot with green circles and red shapes |
**Layer 1:**
* **λ = 0.0:** The plot shows a mix of green circles (Truth Baseline) and red squares/triangles (Lying Baseline/Honesty Control). The green circles are relatively well-mixed with the red shapes.
* **λ = 0.5:** The plot shows a higher concentration of red shapes (Lying Baseline/Honesty Control) compared to green circles (Truth Baseline). The red shapes appear to dominate the plot.
* **λ = 1.0:** The plot shows a further increase in the concentration of red shapes (Lying Baseline/Honesty Control), with green circles (Truth Baseline) becoming less prevalent.
**Layer 16:**
* **λ = 0.0:** The plot shows a clear separation between the green circles (Truth Baseline) and the red shapes (Lying Baseline/Honesty Control). The green circles form a distinct vertical cluster on the right side of the plot. The red shapes dominate the rest of the plot.
* **λ = 0.5:** The separation between the green circles (Truth Baseline) and the red shapes (Lying Baseline/Honesty Control) is maintained. The green cluster on the right appears slightly smaller.
* **λ = 1.0:** The separation is still present, with the green cluster on the right remaining relatively consistent.
**Layer 31:**
* **λ = 0.0:** The plot shows a mix of green circles (Truth Baseline) and red shapes (Lying Baseline/Honesty Control), similar to Layer 1. The green circles are more concentrated on the right side.
* **λ = 0.5:** The plot shows a higher concentration of red shapes (Lying Baseline/Honesty Control) compared to green circles (Truth Baseline).
* **λ = 1.0:** The plot shows a further increase in the concentration of red shapes (Lying Baseline/Honesty Control), with green circles (Truth Baseline) becoming less prevalent.
### Key Observations
* As the layer number increases (from Layer 1 to Layer 16), there is a clear separation between the "Truth Baseline" and "Lying Baseline/Honesty Control."
* As the behavior coefficient λ increases (from 0.0 to 1.0), the "Lying Baseline/Honesty Control" becomes more dominant, and the "Truth Baseline" becomes less prevalent, especially in Layer 1 and Layer 31.
* Layer 16 shows a distinct separation between the "Truth Baseline" and "Lying Baseline/Honesty Control" regardless of the behavior coefficient λ.
### Interpretation
The data suggests that as the LLM processes information through deeper layers (specifically Layer 16), it develops a more distinct separation between truthful and lying behaviors. The behavior coefficient λ influences the overall tendency of the model towards lying, with higher values leading to a greater prevalence of "Lying Baseline/Honesty Control." The plots for Layer 1 and Layer 31 show a more mixed behavior, indicating that the separation between truth and lies is not as clear in these layers compared to Layer 16. This could imply that Layer 16 plays a critical role in differentiating between truthful and deceptive information within the LLM. The "Honesty Control" data series (red triangles) appears to follow a similar trend to the "Lying Baseline" (red squares), suggesting that the control mechanism is effective in promoting lying behavior when λ is increased.