# Technical Document Extraction: LLM Layer Activation Analysis
## 1. Document Overview
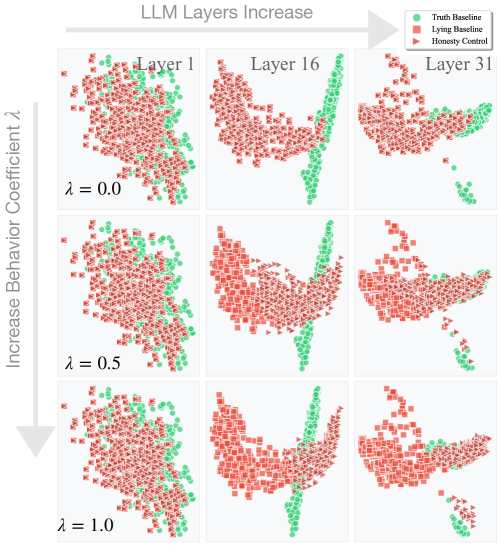
This image is a technical visualization consisting of a 3x3 grid of scatter plots. It illustrates the separation of internal model representations (activations) across different layers of a Large Language Model (LLM) under varying intervention strengths.
## 2. Global Labels and Axes
* **Top Horizontal Axis (Header):** A large grey arrow pointing right labeled **"LLM Layers Increase"**.
* **Left Vertical Axis:** A large grey arrow pointing down labeled **"Increase Behavior Coefficient $\lambda$"**.
* **Legend (Top Right):**
* **Truth Baseline:** Represented by **Green Circles**.
* **Lying Baseline:** Represented by **Red Squares**.
* **Honesty Control:** Represented by **Red Triangles (pointing right)**.
## 3. Grid Structure and Component Isolation
The visualization is organized into three columns (representing model depth) and three rows (representing intervention intensity).
| | Layer 1 | Layer 16 | Layer 31 |
| :--- | :--- | :--- | :--- |
| **$\lambda = 0.0$** | Plot (1,1) | Plot (1,2) | Plot (1,3) |
| **$\lambda = 0.5$** | Plot (2,1) | Plot (2,2) | Plot (2,3) |
| **$\lambda = 1.0$** | Plot (3,1) | Plot (3,2) | Plot (3,3) |
---
## 4. Data Analysis and Trends
### Layer 1 (Initial Representations)
* **Visual Trend:** In all three plots for Layer 1 ($\lambda = 0.0, 0.5, 1.0$), the data points are highly interleaved. There is no clear linear or spatial separation between the "Truth Baseline" (green circles) and the "Lying/Honesty" categories (red squares/triangles).
* **Observation:** The intervention coefficient $\lambda$ has no visible effect on the clustering at this early stage of the model.
### Layer 16 (Intermediate Representations)
* **Visual Trend:** A distinct structural change occurs. The "Truth Baseline" (green circles) forms a narrow, vertical, slightly curved "filament" or line. The "Lying Baseline" (red squares) and "Honesty Control" (red triangles) form a separate, broader "U-shaped" or "wing-shaped" cluster to the left.
* **Intervention Effect:**
* At **$\lambda = 0.0$**, there is a clear gap between the green truth filament and the red clusters.
* As **$\lambda$ increases to 1.0**, the "Honesty Control" (red triangles) begins to shift slightly closer to or overlaps more with the "Truth Baseline" filament compared to the "Lying Baseline" (red squares).
### Layer 31 (Final Representations)
* **Visual Trend:** The clusters become more condensed. The "Truth Baseline" (green circles) is concentrated in a tight cluster on the right, with a small secondary cluster at the bottom right. The "Lying Baseline" (red squares) forms a dense mass on the left.
* **Intervention Effect:**
* At **$\lambda = 0.0$**, the "Honesty Control" (red triangles) is almost entirely overlapping with the "Lying Baseline" (red squares).
* At **$\lambda = 1.0$**, there is a significant migration. A large portion of the "Honesty Control" (red triangles) has moved away from the "Lying Baseline" (red squares) and is now positioned on the right side, overlapping with or adjacent to the "Truth Baseline" (green circles).
---
## 5. Summary of Findings
1. **Depth-Dependent Separation:** The model's ability to distinguish between "Truth" and "Lying" activations increases significantly as data moves from Layer 1 to Layer 31.
2. **Intervention Efficacy:** The "Behavior Coefficient $\lambda$" (likely a steering vector or honesty intervention) is most effective in the deeper layers (Layer 31).
3. **Control Alignment:** At high $\lambda$ values in Layer 31, the "Honesty Control" activations (red triangles) are successfully shifted from the "Lying" distribution toward the "Truth" distribution, indicating the intervention is working as intended to align internal representations with truthful states.