## Scatter Plot Matrix: LLM Layers Increase
### Overview
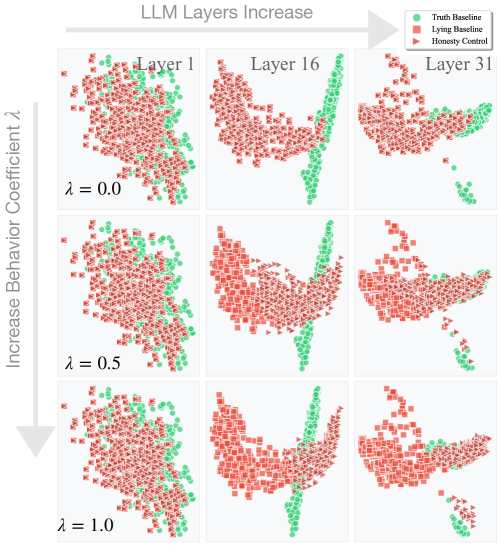
The image presents a 3x3 matrix of scatter plots, visualizing the relationship between "Increase Behavior Coefficient λ" (y-axis) and an unspecified variable (x-axis) for different layers of a Large Language Model (LLM). Each plot represents a different combination of λ (0.0, 0.5, 1.0) and LLM layer (Layer 1, Layer 16, Layer 31). The points are color-coded to represent "Truth Baseline", "Lying Baseline", and "Honesty Control".
### Components/Axes
* **Title:** "LLM Layers Increase" (top-center)
* **Y-axis Label:** "Increase Behavior Coefficient λ" (left side)
* **X-axis Label:** Not explicitly labeled, but represents some variable influencing behavior.
* **Legend:** Located in the top-right corner.
* Green: "Truth Baseline"
* Red: "Lying Baseline"
* Triangle: "Honesty Control"
* **Matrix Rows:** Representing values of λ: 0.0 (top row), 0.5 (middle row), 1.0 (bottom row).
* **Matrix Columns:** Representing LLM layers: Layer 1 (left column), Layer 16 (center column), Layer 31 (right column).
### Detailed Analysis or Content Details
The plots show distributions of points for each combination of λ and layer. Due to the density of points, precise numerical values are difficult to extract, but we can describe the general trends and distributions.
**λ = 0.0**
* **Layer 1:** The points are densely clustered. The majority are red ("Lying Baseline"), with a smaller, more dispersed group of green ("Truth Baseline") points. A few triangle ("Honesty Control") points are scattered throughout. The distribution appears roughly uniform across the x-axis.
* **Layer 16:** The red points ("Lying Baseline") form a more elongated, curved shape, extending upwards and to the right. The green points ("Truth Baseline") are concentrated in the lower-left region. Triangle points ("Honesty Control") are scattered.
* **Layer 31:** The red points ("Lying Baseline") continue the elongated, curved shape observed in Layer 16, but are more dispersed. The green points ("Truth Baseline") are even more concentrated in the lower-left. Triangle points ("Honesty Control") are scattered.
**λ = 0.5**
* **Layer 1:** Similar to λ=0.0, Layer 1, with a dense cluster of red points ("Lying Baseline") and a smaller, dispersed group of green points ("Truth Baseline"). Triangle points ("Honesty Control") are scattered.
* **Layer 16:** The red points ("Lying Baseline") form a more pronounced curved shape, extending further upwards and to the right than in Layer 1. The green points ("Truth Baseline") are more concentrated in the lower-left. Triangle points ("Honesty Control") are scattered.
* **Layer 31:** The red points ("Lying Baseline") continue the curved shape, becoming even more elongated and dispersed. The green points ("Truth Baseline") are highly concentrated in the lower-left. Triangle points ("Honesty Control") are scattered.
**λ = 1.0**
* **Layer 1:** The red points ("Lying Baseline") are still dominant, but the green points ("Truth Baseline") appear slightly more numerous and less dispersed than in the previous rows. Triangle points ("Honesty Control") are scattered.
* **Layer 16:** The red points ("Lying Baseline") form a very distinct, elongated curved shape. The green points ("Truth Baseline") are tightly clustered in the lower-left. Triangle points ("Honesty Control") are scattered.
* **Layer 31:** The red points ("Lying Baseline") are highly elongated and dispersed, forming a clear curved pattern. The green points ("Truth Baseline") are extremely concentrated in the lower-left. Triangle points ("Honesty Control") are scattered.
### Key Observations
* As the LLM layer increases (from 1 to 31), the distribution of "Lying Baseline" points (red) tends to become more elongated and curved, suggesting a stronger correlation between the x-axis variable and the tendency to lie.
* The "Truth Baseline" points (green) consistently remain concentrated in the lower-left region, indicating a lower value on the x-axis for truthful responses.
* Increasing λ (from 0.0 to 1.0) appears to slightly increase the number of "Truth Baseline" points (green) in the earlier layers (Layer 1), but this effect is less pronounced in later layers.
* The "Honesty Control" points (triangles) are sparsely distributed across all plots, suggesting that honesty control doesn't strongly influence the overall behavior.
### Interpretation
The data suggests that as the LLM layers increase, the model becomes more capable of generating responses that correlate with a specific behavior (lying, as indicated by the red points). The curvature of the red point distributions implies a non-linear relationship between the x-axis variable and the likelihood of lying. The concentration of green points in the lower-left suggests that truthful responses are associated with lower values of the x-axis variable.
The "Increase Behavior Coefficient λ" likely controls the degree to which the model is incentivized to exhibit a particular behavior. As λ increases, the model appears to become more sensitive to the underlying patterns, but this effect is more pronounced in the earlier layers. The consistent clustering of truthful responses suggests a fundamental bias towards truthfulness, which is overridden by the incentivized behavior in later layers.
The sparse distribution of "Honesty Control" points indicates that this control mechanism is not very effective in counteracting the incentivized behavior. The data highlights a potential trade-off between model complexity (number of layers) and the ability to control its behavior. The model's capacity to generate complex responses increases with layers, but so does its susceptibility to exhibiting undesirable behaviors.