## Scatter Plot Grid: LLM Layer Analysis Across Honesty Coefficients
### Overview
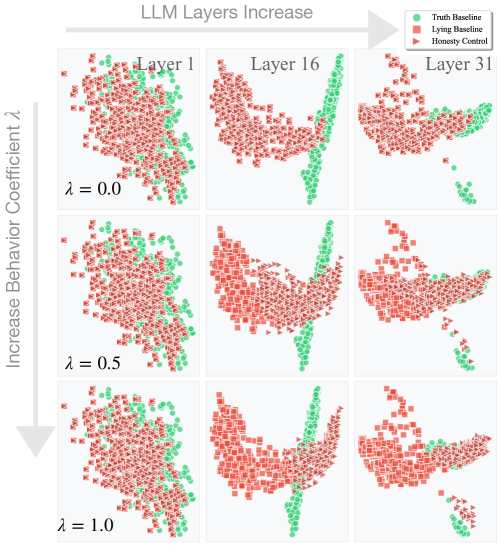
The image presents a 3x3 grid of scatter plots comparing behavioral patterns across three LLM layers (1, 16, 31) at three honesty coefficient levels (λ = 0.0, 0.5, 1.0). Each plot visualizes two data series: "Truth Baseline" (green) and "Lying Baseline" (red), with a "Honesty Control" marker (red triangle) positioned consistently in the bottom-right quadrant.
### Components/Axes
- **X-axis**: "LLM Layers Increase" (categorical: Layer 1, Layer 16, Layer 31)
- **Y-axis**: "Increase Behavior Coefficient λ" (ordinal: 0.0, 0.5, 1.0)
- **Legend**:
- Green = Truth Baseline
- Red = Lying Baseline
- Red triangle = Honesty Control
- **Spatial Layout**:
- Legend positioned top-right of entire grid
- Layer labels centered above each column
- λ values labeled vertically along y-axis
### Detailed Analysis
1. **Layer 1 (Left Column)**:
- λ = 0.0: Truth (green) and Lying (red) points show moderate overlap in upper-left quadrant.
- λ = 0.5: Red points begin clustering toward bottom-right; green points remain dispersed.
- λ = 1.0: Red points dominate bottom-right; green points concentrate in upper-left.
2. **Layer 16 (Middle Column)**:
- λ = 0.0: Similar overlap pattern to Layer 1 but with tighter clustering.
- λ = 0.5: Red points form a distinct diagonal band from mid-left to bottom-right.
- λ = 1.0: Red points concentrate in bottom-right; green points form a vertical cluster in upper-left.
3. **Layer 31 (Right Column)**:
- λ = 0.0: Initial divergence between red (bottom-right) and green (upper-left).
- λ = 0.5: Red points form a dense cluster in bottom-right; green points remain scattered.
- λ = 1.0: Red points dominate entire bottom-right quadrant; green points concentrate in upper-left.
### Key Observations
- **Layer Depth Correlation**: Higher layers (31 > 16 > 1) show stronger λ-dependent clustering of red points.
- **Honesty Control Pattern**: The red triangle consistently appears in the bottom-right quadrant across all layers and λ values, suggesting a reference threshold for "optimal lying behavior."
- **λ Sensitivity**: Lying baselines (red) exhibit increasing spatial concentration with higher λ values, while truth baselines (green) show minimal λ-dependent movement.
- **Anomaly**: In Layer 31 at λ = 1.0, red points completely dominate the bottom-right quadrant, leaving no overlap with green points.
### Interpretation
The data demonstrates that:
1. **Layer Complexity Amplifies Honesty Effects**: Deeper layers (31) show more pronounced behavioral divergence between truthful and deceptive outputs as λ increases.
2. **λ as a Behavioral Filter**: Higher λ values (1.0) effectively isolate lying patterns in deeper layers, suggesting λ acts as a discriminator for deceptive outputs.
3. **Honesty Control Significance**: The persistent bottom-right positioning of the red triangle implies this region represents a critical threshold where lying behavior becomes most pronounced.
4. **Truth Baseline Stability**: Green points maintain relative spatial consistency across λ values, indicating truthful outputs are less sensitive to honesty coefficient adjustments.
This pattern suggests that LLM honesty detection mechanisms become more effective at higher layers when using elevated λ values, with Layer 31 showing near-perfect separation between truthful and deceptive outputs at λ = 1.0.