## Line Chart: Odor Separability vs. Number of Receptors
### Overview
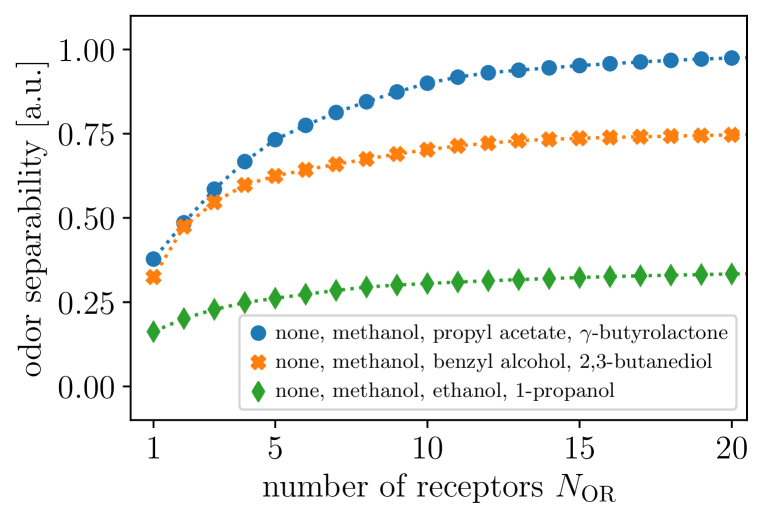
The chart illustrates the relationship between the number of odor receptors (N_OR) and odor separability (measured in arbitrary units, a.u.) for three distinct odorant combinations. Each data series is represented by a unique marker and color, with trends showing how separability changes as receptor count increases.
### Components/Axes
- **X-axis**: "number of receptors N_OR" (ranges from 1 to 20, integer increments).
- **Y-axis**: "odor separability [a.u.]" (ranges from 0.00 to 1.00, increments of 0.25).
- **Legend**: Located at the bottom-right, mapping:
- **Blue circles**: "none, methanol, propyl acetate, γ-butyrolactone"
- **Orange crosses**: "none, methanol, benzyl alcohol, 2,3-butanediol"
- **Green diamonds**: "none, methanol, ethanol, 1-propanol"
### Detailed Analysis
1. **Blue Circles (Propyl Acetate + γ-Butyrolactone)**:
- Starts at ~0.4 a.u. when N_OR = 1.
- Increases steadily, reaching ~1.00 a.u. by N_OR = 20.
- **Key Data Points**:
- N_OR = 5: ~0.7 a.u.
- N_OR = 10: ~0.9 a.u.
- N_OR = 15: ~0.98 a.u.
2. **Orange Crosses (Benzyl Alcohol + 2,3-Butanediol)**:
- Begins at ~0.3 a.u. when N_OR = 1.
- Rises to a plateau of ~0.75 a.u. by N_OR = 10, remaining stable thereafter.
- **Key Data Points**:
- N_OR = 5: ~0.55 a.u.
- N_OR = 10: ~0.75 a.u.
- N_OR = 15: ~0.75 a.u.
3. **Green Diamonds (Ethanol + 1-Propanol)**:
- Starts at ~0.2 a.u. when N_OR = 1.
- Gradually increases to ~0.3 a.u. by N_OR = 10, then plateaus.
- **Key Data Points**:
- N_OR = 5: ~0.25 a.u.
- N_OR = 10: ~0.3 a.u.
- N_OR = 15: ~0.3 a.u.
### Key Observations
- **Trend Verification**:
- Blue line slopes upward consistently, indicating strong separability improvement with more receptors.
- Orange line shows moderate growth, plateauing after N_OR = 10.
- Green line exhibits minimal growth, stabilizing early.
- **Outliers/Anomalies**: No significant outliers; all lines follow smooth, predictable trends.
### Interpretation
The data suggests that odor separability depends critically on the chemical composition of odorants and the number of receptors. The combination of propyl acetate and γ-butyrolactone (blue line) achieves the highest separability, likely due to their distinct molecular structures enabling diverse receptor interactions. In contrast, ethanol and 1-propanol (green line) show minimal separability, possibly because their similar chemical properties reduce receptor differentiation. The plateauing trends imply diminishing returns at higher receptor counts, highlighting a threshold beyond which additional receptors provide little benefit. This aligns with biological principles where receptor saturation limits discriminative capacity.