## State Transition Diagram: Epistemic and Temporal Transitions
### Overview
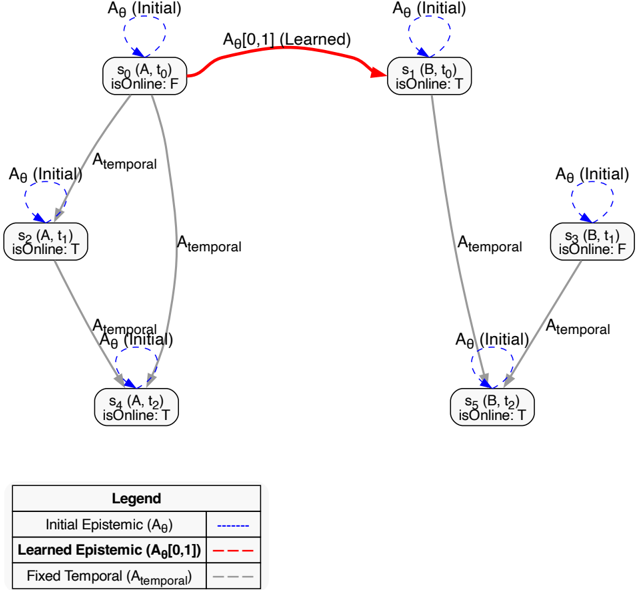
The image presents a state transition diagram illustrating transitions between states based on epistemic and temporal factors. The diagram includes nodes representing states, labeled with state identifiers (s0, s1, s2, s3, s4, s5), associated agents (A or B), time points (t0, t1, t2), and an "isOnline" status (True or False). Transitions between states are marked with different line styles representing different types of transitions: Initial Epistemic, Learned Epistemic, and Fixed Temporal.
### Components/Axes
* **Nodes:** Represent states, labeled as s0, s1, s2, s3, s4, s5. Each node contains:
* State Identifier (e.g., s0)
* Agent (A or B)
* Time (t0, t1, or t2)
* isOnline status (T or F)
* **Edges:** Represent transitions between states, labeled with transition types:
* Aθ (Initial): Initial Epistemic transition (blue dashed line with arrow)
* Aθ[0,1] (Learned): Learned Epistemic transition (red dashed line with arrow)
* Atemporal: Fixed Temporal transition (gray dashed line with arrow)
* **Legend:** Located at the bottom of the image.
* Initial Epistemic (Aθ): Blue dashed line
* Learned Epistemic (Aθ[0,1]): Red dashed line
* Fixed Temporal (Atemporal): Gray dashed line
### Detailed Analysis or Content Details
* **State s0:** (A, t0), isOnline: F. Located at the top-left.
* Has an Initial Epistemic transition (blue dashed line) looping back to itself.
* Has a Learned Epistemic transition (red dashed line) to state s1.
* Has a Fixed Temporal transition (gray dashed line) to state s2.
* Has a Fixed Temporal transition (gray dashed line) to state s4.
* **State s1:** (B, t0), isOnline: T. Located at the top-right.
* Has an Initial Epistemic transition (blue dashed line) looping back to itself.
* Has a Fixed Temporal transition (gray dashed line) to state s5.
* Has a Fixed Temporal transition (gray dashed line) to state s3.
* **State s2:** (A, t1), isOnline: T. Located at the mid-left.
* Has an Initial Epistemic transition (blue dashed line) looping back to itself.
* **State s3:** (B, t1), isOnline: F. Located at the mid-right.
* Has an Initial Epistemic transition (blue dashed line) looping back to itself.
* **State s4:** (A, t2), isOnline: T. Located at the bottom-left.
* Has an Initial Epistemic transition (blue dashed line) looping back to itself.
* **State s5:** (B, t2), isOnline: T. Located at the bottom-right.
* Has an Initial Epistemic transition (blue dashed line) looping back to itself.
### Key Observations
* The diagram illustrates transitions between states based on epistemic and temporal factors.
* States s0 and s1 are the starting points, with a learned epistemic transition from s0 to s1.
* Each state has an initial epistemic transition looping back to itself.
* Temporal transitions connect states with different time points (t0, t1, t2).
* The "isOnline" status changes between states.
### Interpretation
The state transition diagram models a system where agents (A and B) transition between states based on learned and temporal factors. The "isOnline" status represents a binary condition associated with each state. The diagram suggests a learning process where the system transitions from state s0 to s1 through a learned epistemic transition. The temporal transitions indicate how the system evolves over time, with agents potentially changing their "isOnline" status. The initial epistemic transitions looping back to each state may represent a form of self-reinforcement or persistence within that state.