## Heatmaps: Qwen3 Model Layer Analysis
### Overview
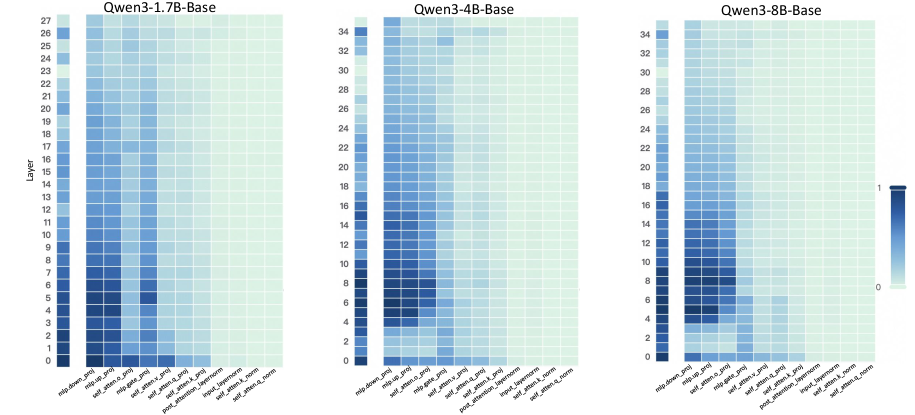
The image presents three heatmaps comparing the activity across different layers and components of Qwen3 models with varying sizes (1.7B, 4B, and 8B parameters). The heatmaps visualize the relative activation levels within each layer for different modules, providing insights into how the model's processing changes with scale.
### Components/Axes
* **Titles:**
* Top-left: "Qwen3-1.7B-Base"
* Top-center: "Qwen3-4B-Base"
* Top-right: "Qwen3-8B-Base"
* **Y-axis:** "Layer"
* Leftmost heatmap: Ranges from 0 to 27, incrementing by 1.
* Center heatmap: Ranges from 0 to 34, incrementing by 2.
* Rightmost heatmap: Ranges from 0 to 34, incrementing by 2.
* **X-axis:** (Modules, from left to right)
* "mlp.down_proj"
* "mlp.up_proj"
* "self_atten.o_proj"
* "mlp.gate_proj"
* "self_atten.v_proj"
* "self_atten.q_proj"
* "self_atten.k_proj"
* "post_attention_layernorm"
* "input_layernorm"
* "self_atten.k_norm"
* "self_atten.a_norm"
* **Color Legend:** Located on the right side of the rightmost heatmap. The color gradient ranges from light green (0) to dark blue (1), representing the activation level.
### Detailed Analysis
**Qwen3-1.7B-Base (Left Heatmap):**
* The heatmap shows activity concentrated in the lower layers (0-10).
* **mlp.down_proj:** High activation in layers 0-9, decreasing gradually.
* **mlp.up_proj:** Similar to mlp.down_proj, high activation in layers 0-9.
* **self_atten.o_proj:** Moderate activation in layers 0-5.
* **mlp.gate_proj:** Low to moderate activation in layers 0-5.
* **self_atten.v_proj:** Very low activation across all layers.
* **self_atten.q_proj:** Very low activation across all layers.
* **self_atten.k_proj:** Very low activation across all layers.
* **post_attention_layernorm:** Very low activation across all layers.
* **input_layernorm:** Very low activation across all layers.
* **self_atten.k_norm:** Very low activation across all layers.
* **self_atten.a_norm:** Very low activation across all layers.
**Qwen3-4B-Base (Center Heatmap):**
* Activity is more spread out across the layers compared to the 1.7B model.
* **mlp.down_proj:** High activation in layers 0-15, then decreases.
* **mlp.up_proj:** High activation in layers 0-15, then decreases.
* **self_atten.o_proj:** Moderate activation in layers 0-10.
* **mlp.gate_proj:** Low to moderate activation in layers 0-10.
* **self_atten.v_proj:** Very low activation across all layers.
* **self_atten.q_proj:** Very low activation across all layers.
* **self_atten.k_proj:** Very low activation across all layers.
* **post_attention_layernorm:** Very low activation across all layers.
* **input_layernorm:** Very low activation across all layers.
* **self_atten.k_norm:** Very low activation across all layers.
* **self_atten.a_norm:** Very low activation across all layers.
**Qwen3-8B-Base (Right Heatmap):**
* The activity pattern is similar to the 4B model, but with slightly higher activation in the lower layers.
* **mlp.down_proj:** High activation in layers 0-15, then decreases.
* **mlp.up_proj:** High activation in layers 0-15, then decreases.
* **self_atten.o_proj:** Moderate activation in layers 0-10.
* **mlp.gate_proj:** Low to moderate activation in layers 0-10.
* **self_atten.v_proj:** Very low activation across all layers.
* **self_atten.q_proj:** Very low activation across all layers.
* **self_atten.k_proj:** Very low activation across all layers.
* **post_attention_layernorm:** Very low activation across all layers.
* **input_layernorm:** Very low activation across all layers.
* **self_atten.k_norm:** Very low activation across all layers.
* **self_atten.a_norm:** Very low activation across all layers.
### Key Observations
* The mlp.down_proj and mlp.up_proj modules show the highest activation levels across all three models, particularly in the lower layers.
* The self_atten.o_proj and mlp.gate_proj modules exhibit moderate activation, also concentrated in the lower layers.
* The remaining modules (self_atten.v_proj, self_atten.q_proj, self_atten.k_proj, post_attention_layernorm, input_layernorm, self_atten.k_norm, self_atten.a_norm) show very low activation across all layers and models.
* As the model size increases (1.7B to 4B to 8B), the activity tends to spread out more across the layers, suggesting that larger models utilize more layers for processing.
### Interpretation
The heatmaps provide a visual representation of the internal workings of the Qwen3 models. The concentration of activity in the mlp.down_proj and mlp.up_proj modules suggests that these modules play a crucial role in the model's processing, especially in the initial layers. The low activation of other modules might indicate that they are either less important or that their activity is more distributed and less concentrated in specific layers.
The trend of activity spreading out across more layers as the model size increases suggests that larger models are able to distribute the processing load more effectively, potentially leading to improved performance. The consistent patterns across the different model sizes also indicate that the overall architecture and processing flow remain similar, with the larger models simply scaling up the existing structure.