## Heatmap: Qwen3 Model Parameter Distribution Across Layers
### Overview
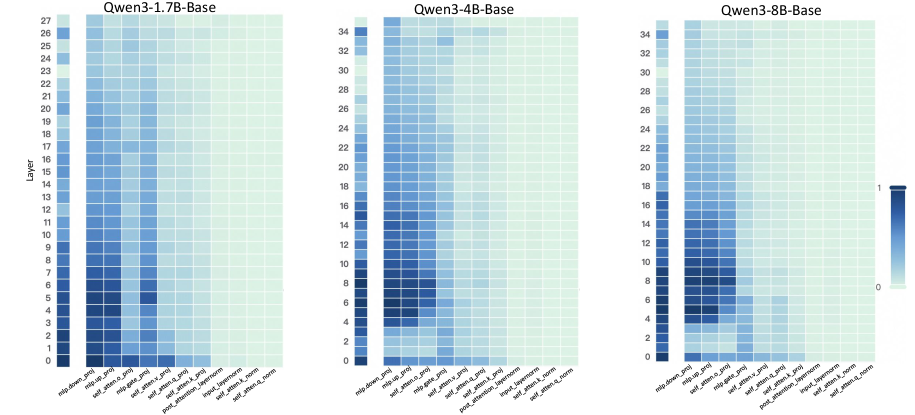
The image displays three comparative heatmaps visualizing parameter distribution patterns across different Qwen3 model architectures (1.7B, 4B, and 8B parameter variants). Each heatmap shows layer-wise distribution of parameters across model components, with color intensity representing parameter concentration (0-1 scale).
### Components/Axes
**Y-Axis (Layers):**
- Left heatmap (1.7B): 0-27 (28 layers)
- Middle heatmap (4B): 0-34 (35 layers)
- Right heatmap (8B): 0-34 (35 layers)
- All share "Layer" label with numerical increments
**X-Axis (Model Components):**
1. mlp_domain_proj
2. mlp_head_proj
3. mlp_head_slice
4. mlp_expert_proj
5. mlp_expert_slice
6. mlp_expert_router
7. mlp_post_proj
8. mlp_post_slice
9. mlp_attention_proj
10. mlp_attention_slice
11. mlp_attention_router
12. mlp_attention_head_proj
13. mlp_attention_head_slice
14. mlp_attention_head_router
15. mlp_attention_head_mlp (only in 4B model)
**Legend:**
- Color scale from dark blue (0) to light blue (1)
- Positioned right of each heatmap
- Consistent across all three visualizations
### Detailed Analysis
**1.5B Model (Left Heatmap):**
- Layers 0-5 show darkest cells (highest concentration)
- Most intense values in mlp_expert_proj (layer 5) and mlp_attention_proj (layer 4)
- Gradual lightening from layer 6 onward
- mlp_head_proj shows consistent mid-range values across layers
**4B Model (Middle Heatmap):**
- Layers 0-10 show darkest concentrations
- Peak values in mlp_expert_proj (layer 10) and mlp_attention_proj (layer 9)
- Distinct gradient from layer 0 (dark) to layer 34 (light)
- mlp_head_proj shows similar pattern to 1.7B model
**8B Model (Right Heatmap):**
- Most intense values in first 15 layers
- mlp_expert_proj shows strongest concentration (layer 15)
- mlp_attention_proj has highest values in layer 14
- Gradual lightening after layer 20
- mlp_head_proj shows less pronounced variation than smaller models
### Key Observations
1. **Layer Depth Correlation:** All models show decreasing parameter concentration with increasing layer depth
2. **Model Size Impact:** Larger models (8B) maintain higher concentration in early layers compared to smaller variants
3. **Component-Specific Patterns:**
- mlp_expert_proj consistently shows highest values across all models
- mlp_attention_proj shows secondary peaks in middle layers
- mlp_head_proj maintains relatively uniform distribution
4. **Gradient Strength:** 8B model exhibits most pronounced gradient (0.8 difference between layer 0 and 34)
5. **Anomaly:** 4B model has unique mlp_attention_head_mlp component not present in smaller variants
### Interpretation
These heatmaps reveal architectural optimization patterns across Qwen3 model variants:
1. **Parameter Distribution Strategy:** All models concentrate parameters in early layers, particularly in mlp_expert_proj components, suggesting prioritization of early-stage information processing
2. **Scaling Effects:** Larger models maintain higher parameter density in initial layers, potentially indicating more sophisticated early feature extraction capabilities
3. **Attention Mechanism:** mlp_attention_proj shows mid-layer concentration peaks, suggesting optimized attention mechanisms in deeper layers
4. **Component Specialization:** The presence of mlp_attention_head_mlp in 4B model indicates specialized attention processing absent in smaller variants
5. **Gradient Analysis:** The steeper gradient in 8B model suggests more efficient parameter utilization across depth, while smaller models show more uniform distribution
The data suggests deliberate architectural choices where larger models optimize for early-layer complexity while maintaining parameter efficiency through controlled distribution patterns. The consistent mlp_expert_proj dominance across all variants highlights its critical role in model performance.