## Bar Chart: Number of theorem attempts it took to solve a theorem
### Overview
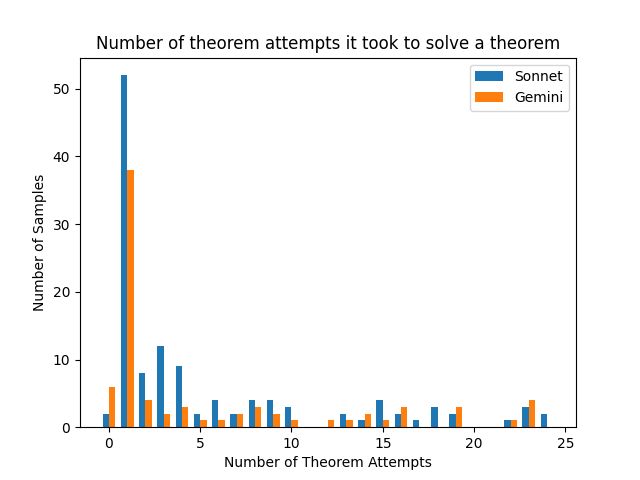
The chart compares the distribution of theorem-solving attempts between two models, Sonnet (blue) and Gemini (orange), across varying numbers of attempts. The y-axis represents the number of samples (theorems) solved, while the x-axis shows the number of attempts required. Both models exhibit distinct patterns in their success rates across attempt counts.
### Components/Axes
- **Title**: "Number of theorem attempts it took to solve a theorem"
- **X-axis**: "Number of Theorem Attempts" (ranges from 0 to 25, with ticks at 0, 5, 10, 15, 20, 25)
- **Y-axis**: "Number of Samples" (ranges from 0 to 50, with ticks at 0, 10, 20, 30, 40, 50)
- **Legend**:
- Blue: Sonnet
- Orange: Gemini
- **Bar Structure**: Two bars per x-axis value (one for each model), with heights proportional to sample counts.
### Detailed Analysis
- **Attempt 0**:
- Sonnet: ~50 samples (highest bar)
- Gemini: ~38 samples (second-highest bar)
- **Attempt 1**:
- Sonnet: ~12 samples
- Gemini: ~5 samples
- **Attempt 2**:
- Sonnet: ~8 samples
- Gemini: ~3 samples
- **Attempt 3**:
- Sonnet: ~10 samples
- Gemini: ~2 samples
- **Attempt 4**:
- Sonnet: ~6 samples
- Gemini: ~1 sample
- **Attempt 5**:
- Sonnet: ~4 samples
- Gemini: ~1 sample
- **Attempt 6**:
- Sonnet: ~3 samples
- Gemini: ~1 sample
- **Attempt 7**:
- Sonnet: ~2 samples
- Gemini: ~1 sample
- **Attempt 8**:
- Sonnet: ~2 samples
- Gemini: ~1 sample
- **Attempt 9**:
- Sonnet: ~2 samples
- Gemini: ~1 sample
- **Attempt 10**:
- Sonnet: ~2 samples
- Gemini: ~1 sample
- **Attempt 11**:
- Sonnet: ~2 samples
- Gemini: ~1 sample
- **Attempt 12**:
- Sonnet: ~2 samples
- Gemini: ~1 sample
- **Attempt 13**:
- Sonnet: ~2 samples
- Gemini: ~1 sample
- **Attempt 14**:
- Sonnet: ~2 samples
- Gemini: ~1 sample
- **Attempt 15**:
- Sonnet: ~2 samples
- Gemini: ~1 sample
- **Attempt 16**:
- Sonnet: ~2 samples
- Gemini: ~1 sample
- **Attempt 17**:
- Sonnet: ~2 samples
- Gemini: ~1 sample
- **Attempt 18**:
- Sonnet: ~2 samples
- Gemini: ~1 sample
- **Attempt 19**:
- Sonnet: ~2 samples
- Gemini: ~1 sample
- **Attempt 20**:
- Sonnet: ~2 samples
- Gemini: ~1 sample
- **Attempt 21**:
- Sonnet: ~2 samples
- Gemini: ~1 sample
- **Attempt 22**:
- Sonnet: ~2 samples
- Gemini: ~1 sample
- **Attempt 23**:
- Sonnet: ~2 samples
- Gemini: ~1 sample
- **Attempt 24**:
- Sonnet: ~2 samples
- Gemini: ~1 sample
- **Attempt 25**:
- Sonnet: ~2 samples
- Gemini: ~0 samples
### Key Observations
1. **Initial Dominance**: Both models show significantly higher sample counts at 0 attempts, with Sonnet outperforming Gemini (50 vs. 38).
2. **Rapid Decline**: Sample counts drop sharply as attempts increase, with both models showing minimal success beyond 5 attempts.
3. **Asymmetry**: Sonnet consistently outperforms Gemini across all attempt counts, though the gap narrows at higher attempts (e.g., 2 samples vs. 1 sample at 25 attempts).
4. **Outliers**: Gemini has no samples at 25 attempts, while Sonnet retains 2 samples, suggesting a slight edge in persistence.
### Interpretation
The data suggests that **Sonnet** is more effective at solving theorems with minimal attempts compared to **Gemini**, particularly in the early stages (0–5 attempts). The steep decline in sample counts as attempts increase implies that both models struggle with theorems requiring more than 5 attempts, possibly due to increased complexity or limitations in their problem-solving capabilities. The persistence of Sonnet at higher attempts (e.g., 2 samples at 25 attempts) hints at a marginally better ability to handle harder problems, though the overall trend indicates diminishing returns for both models beyond 5 attempts. This could reflect differences in training data, algorithmic efficiency, or inherent model biases toward simpler theorems.