## Histogram: Number of Theorem Attempts to Solve a Theorem
### Overview
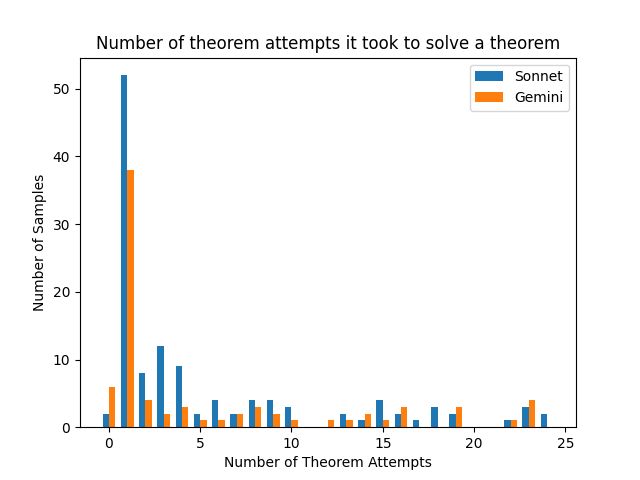
The image is a histogram comparing the number of theorem attempts it took for two systems, "Sonnet" (blue) and "Gemini" (orange), to solve a theorem. The x-axis represents the number of theorem attempts, and the y-axis represents the number of samples (frequency).
### Components/Axes
* **Title:** Number of theorem attempts it took to solve a theorem
* **X-axis:** Number of Theorem Attempts (ranging from 0 to 25)
* **Y-axis:** Number of Samples (ranging from 0 to 50)
* **Legend:** Located in the top-right corner.
* Blue: Sonnet
* Orange: Gemini
### Detailed Analysis
Here's a breakdown of the data for each system:
**Sonnet (Blue):**
* **Trend:** The frequency is highest at 1 attempt and decreases rapidly as the number of attempts increases.
* **Data Points:**
* 0 Attempts: ~2
* 1 Attempt: ~52
* 2 Attempts: ~12
* 3 Attempts: ~9
* 4 Attempts: ~3
* 5 Attempts: ~4
* 6 Attempts: ~2
* 7 Attempts: ~1
* 8 Attempts: ~4
* 9 Attempts: ~2
* 10 Attempts: ~1
* 11 Attempts: ~0
* 12 Attempts: ~0
* 13 Attempts: ~0
* 14 Attempts: ~2
* 15 Attempts: ~1
* 16 Attempts: ~2
* 17 Attempts: ~0
* 18 Attempts: ~0
* 19 Attempts: ~0
* 20 Attempts: ~0
* 21 Attempts: ~0
* 22 Attempts: ~0
* 23 Attempts: ~0
* 24 Attempts: ~2
* 25 Attempts: ~3
**Gemini (Orange):**
* **Trend:** Similar to Sonnet, the frequency is highest at 1 attempt and decreases as the number of attempts increases, but the decrease is less drastic.
* **Data Points:**
* 0 Attempts: ~6
* 1 Attempt: ~38
* 2 Attempts: ~8
* 3 Attempts: ~3
* 4 Attempts: ~2
* 5 Attempts: ~1
* 6 Attempts: ~4
* 7 Attempts: ~3
* 8 Attempts: ~3
* 9 Attempts: ~4
* 10 Attempts: ~2
* 11 Attempts: ~0
* 12 Attempts: ~0
* 13 Attempts: ~0
* 14 Attempts: ~1
* 15 Attempts: ~4
* 16 Attempts: ~2
* 17 Attempts: ~3
* 18 Attempts: ~1
* 19 Attempts: ~3
* 20 Attempts: ~0
* 21 Attempts: ~0
* 22 Attempts: ~0
* 23 Attempts: ~1
* 24 Attempts: ~4
* 25 Attempts: ~1
### Key Observations
* Both systems solve most theorems within the first few attempts.
* Sonnet has a higher peak at 1 attempt compared to Gemini.
* Gemini has a more gradual decrease in frequency as the number of attempts increases, suggesting it might be more consistent in solving theorems that require more attempts.
* Both systems have a few instances where they require a significantly higher number of attempts (24-25).
### Interpretation
The histogram suggests that both "Sonnet" and "Gemini" are generally successful in solving theorems with a low number of attempts. However, "Sonnet" appears to be more efficient at solving theorems quickly, as indicated by its higher peak at 1 attempt. "Gemini," on the other hand, seems to have a more consistent performance across a wider range of attempts, potentially indicating a more robust approach to solving more complex theorems. The presence of data points at higher attempt numbers (24-25) for both systems suggests that there are some theorems that pose a significant challenge to both systems.