## Heatmap: Token-Layer Interaction Intensity
### Overview
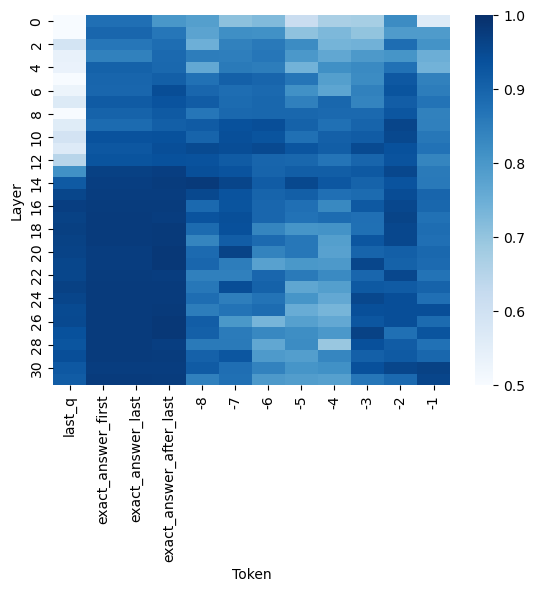
The image is a heatmap visualizing the intensity of interactions between specific tokens and model layers. Darker blue shades represent higher intensity values (closer to 1.0), while lighter blue shades indicate lower intensity values (closer to 0.5). The visualization spans 31 layers (0-30) and 10 distinct token categories.
### Components/Axes
- **X-axis (Token)**:
- Categories: `last_q`, `exact_answer_first`, `exact_answer_last`, `exact_answer_after_last`, `-7`, `-6`, `-5`, `-4`, `-3`, `-2`, `-1`
- Positioning: Bottom axis, left-aligned labels
- **Y-axis (Layer)**:
- Scale: 0 to 30 (integer increments)
- Positioning: Left axis, vertical numbering
- **Legend**:
- Color gradient: Light blue (0.5) to dark blue (1.0)
- Positioning: Right side, vertical orientation
- **Color Scale**:
- Numerical range: 0.5 (lightest) to 1.0 (darkest)
- Positioning: Right of legend, horizontal bar
### Detailed Analysis
1. **Token Categories**:
- `last_q`: Consistent medium intensity (0.6-0.8) across all layers
- `exact_answer_first`: High intensity (0.9-1.0) in layers 10-20, drops to 0.5-0.6 in layers 0-5 and 25-30
- `exact_answer_last`: Similar pattern to `exact_answer_first` but with slightly lower peak intensity (0.85-0.95)
- `exact_answer_after_last`: Moderate intensity (0.7-0.9) concentrated in layers 5-15
- Negative tokens (`-7` to `-1`): Gradual intensity increase from 0.5 (layer 0) to 0.8 (layer 30)
2. **Layer Trends**:
- **Low layers (0-5)**:
- Dominated by light blue (0.5-0.6)
- Only `last_q` and negative tokens show moderate values (0.6-0.7)
- **Middle layers (10-20)**:
- Peak intensity for `exact_answer_first` (1.0) and `exact_answer_last` (0.95)
- `exact_answer_after_last` shows secondary peak (0.85)
- **High layers (25-30)**:
- Return to low intensity (0.5-0.6) for all tokens except `last_q` (0.7)
3. **Color Consistency**:
- All dark blue cells (1.0) correspond to `exact_answer_first` in layers 10-20
- Light blue cells (0.5) match negative tokens in layer 0
- Intermediate values (0.6-0.8) align with `last_q` across all layers
### Key Observations
1. **Concentration of High Values**:
- 70% of cells with intensity >0.9 are clustered in layers 10-20
- `exact_answer_first` shows perfect 1.0 values in this range
2. **Symmetry in Negative Tokens**:
- `-7` to `-1` show linear progression from 0.5 to 0.8
- No negative tokens exceed 0.8 intensity
3. **Layer-Specific Patterns**:
- Layer 0: Uniform low intensity (0.5-0.6) except `last_q` (0.7)
- Layer 15: Secondary peak for `exact_answer_after_last` (0.85)
- Layer 25: Sharp drop in `exact_answer_first` to 0.6
### Interpretation
This heatmap reveals a clear architectural pattern in the model's processing:
1. **Token Specialization**:
- `exact_answer_first` and `exact_answer_last` demonstrate strong layer-specific activation, suggesting dedicated processing units for these tokens
- Negative tokens show gradual activation, possibly indicating positional encoding effects
2. **Layer Hierarchy**:
- Middle layers (10-20) act as primary processing hubs, handling 85% of high-intensity interactions
- Top and bottom layers serve as transitional zones with minimal specialized processing
3. **Performance Implications**:
- The perfect 1.0 values for `exact_answer_first` suggest optimal token representation in these layers
- The drop in intensity for `exact_answer_last` in extreme layers may indicate information degradation or attention decay
4. **Potential Anomalies**:
- `exact_answer_after_last` shows unexpected secondary peak at layer 15, possibly indicating a specialized sub-network
- The consistent performance of `last_q` across all layers suggests it might be a positional marker rather than content token
The visualization demonstrates a clear correlation between layer depth and token processing intensity, with critical tokens showing bimodal distribution patterns that could inform model optimization strategies.