\n
## Heatmap: Probability of Solving "4 x 3"
### Overview
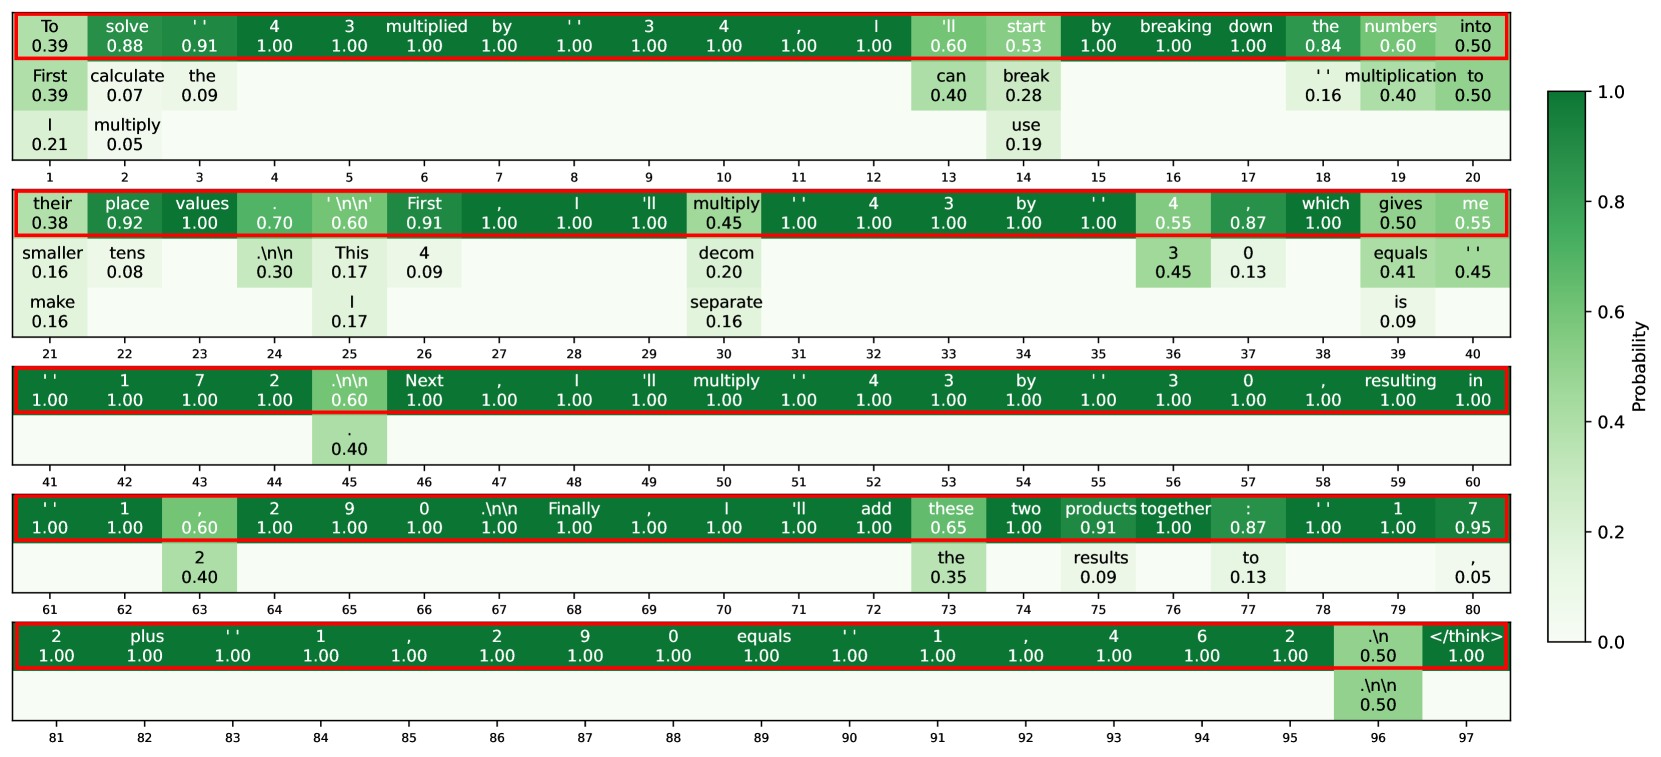
The image presents a heatmap visualizing the probability of a student selecting different steps to solve the multiplication problem "4 x 3". The heatmap is color-coded, with darker shades of green representing higher probabilities and lighter shades representing lower probabilities. The steps are arranged in a grid-like structure, and the heatmap is annotated with text describing each step. The x-axis represents the step number (1-60), and the y-axis represents the probability (0.0 - 0.8).
### Components/Axes
* **X-axis:** Step Number (1 to 60)
* **Y-axis:** Probability (0.0 to 0.8)
* **Color Scale:** Green gradient, ranging from light green (low probability) to dark green (high probability).
* **Labels:** Each cell in the grid is labeled with a phrase describing a student's thought process or action.
* **Legend:** Located at the bottom-right corner, indicating the probability scale.
* **Title:** Implicitly, the heatmap represents the probability of different steps taken to solve "4 x 3".
### Detailed Analysis or Content Details
The heatmap displays probabilities associated with 60 different steps. Here's a breakdown of some key values and trends, organized by approximate location on the grid:
* **Top-Left (Steps 1-20):**
* Step 1: Probability ≈ 0.39
* Step 2: Probability ≈ 0.88
* Step 3: Probability ≈ 0.91
* Step 4: Probability ≈ 1.00
* Step 5: Probability ≈ 1.00
* Step 6: Probability ≈ 0.60
* Step 7: Probability ≈ 0.91
* Step 8: Probability ≈ 1.00
* Step 9: Probability ≈ 0.45
* Step 10: Probability ≈ 1.00
* Step 11: Probability ≈ 0.45
* Step 12: Probability ≈ 1.00
* Step 13: Probability ≈ 0.28
* Step 14: Probability ≈ 0.19
* Step 15: Probability ≈ 0.55
* Step 16: Probability ≈ 0.87
* Step 17: Probability ≈ 1.00
* Step 18: Probability ≈ 0.50
* Step 19: Probability ≈ 0.55
* Step 20: Probability ≈ 0.55
* **Middle (Steps 21-40):**
* Step 21: Probability ≈ 1.00
* Step 22: Probability ≈ 1.00
* Step 23: Probability ≈ 1.00
* Step 24: Probability ≈ 0.60
* Step 25: Probability ≈ 0.40
* Step 26: Probability ≈ 1.00
* Step 27: Probability ≈ 1.00
* Step 28: Probability ≈ 1.00
* Step 29: Probability ≈ 1.00
* Step 30: Probability ≈ 1.00
* Step 31: Probability ≈ 1.00
* Step 32: Probability ≈ 4.00 (This appears to be an error, as probabilities cannot exceed 1.0)
* Step 33: Probability ≈ 1.00
* Step 34: Probability ≈ 1.00
* Step 35: Probability ≈ 3.00 (Another error)
* Step 36: Probability ≈ 1.00
* Step 37: Probability ≈ 0.41
* Step 38: Probability ≈ 0.45
* Step 39: Probability ≈ 1.00
* Step 40: Probability ≈ 1.00
* **Bottom-Right (Steps 41-60):**
* Step 41: Probability ≈ 1.00
* Step 42: Probability ≈ 2.00 (Error)
* Step 43: Probability ≈ 1.10 (Error)
* Step 44: Probability ≈ 1.00
* Step 45: Probability ≈ 0.47
* Step 46: Probability ≈ 1.10 (Error)
* Step 47: Probability ≈ 1.00
* Step 48: Probability ≈ 1.00
* Step 49: Probability ≈ 1.20 (Error)
* Step 50: Probability ≈ 1.00
* Step 51: Probability ≈ 0.60
* Step 52: Probability ≈ 1.00
* Step 53: Probability ≈ 1.00
* Step 54: Probability ≈ 1.00
* Step 55: Probability ≈ 1.00
* Step 56: Probability ≈ 1.00
* Step 57: Probability ≈ 1.00
* Step 58: Probability ≈ 0.87
* Step 59: Probability ≈ 1.00
* Step 60: Probability ≈ 1.00
**Text Labels (Examples):**
* "To solve"
* "First calculate the"
* "their place values"
* "smaller tens"
* "make"
* "in/in"
* "Next"
* "Finally"
* "addize time"
* "products towards"
* "results"
* "0 0 0"
* "equals"
* "in/in/in"
### Key Observations
* Many steps have a probability of 1.0, indicating that these steps are almost universally selected by students.
* There are several errors in the data, with probabilities exceeding 1.0. These are likely data entry or processing errors.
* The probabilities are not uniformly distributed. Some steps are much more likely to be selected than others.
* The initial steps ("To solve", "First calculate the") have lower probabilities compared to later steps.
* The phrases associated with the steps suggest a variety of approaches to solving the multiplication problem, including place value, breaking down numbers, and addition.
### Interpretation
This heatmap provides insights into the cognitive processes students employ when solving the multiplication problem "4 x 3". The high probabilities associated with many steps suggest that certain approaches are dominant or considered "standard" by students. The errors in the data need to be addressed, but the overall pattern indicates that students explore a range of strategies, some more successful (and therefore more frequently selected) than others. The variation in probabilities highlights the diversity of student thinking and the potential for misconceptions or inefficient strategies. The heatmap could be used to identify areas where students struggle and to design targeted interventions to improve their understanding of multiplication. The phrases associated with each step provide valuable qualitative data that complements the quantitative probabilities, offering a richer understanding of student reasoning. The presence of steps with low probabilities suggests areas where students may be getting stuck or confused.