## Heatmap: Textual Probability Distribution Analysis
### Overview
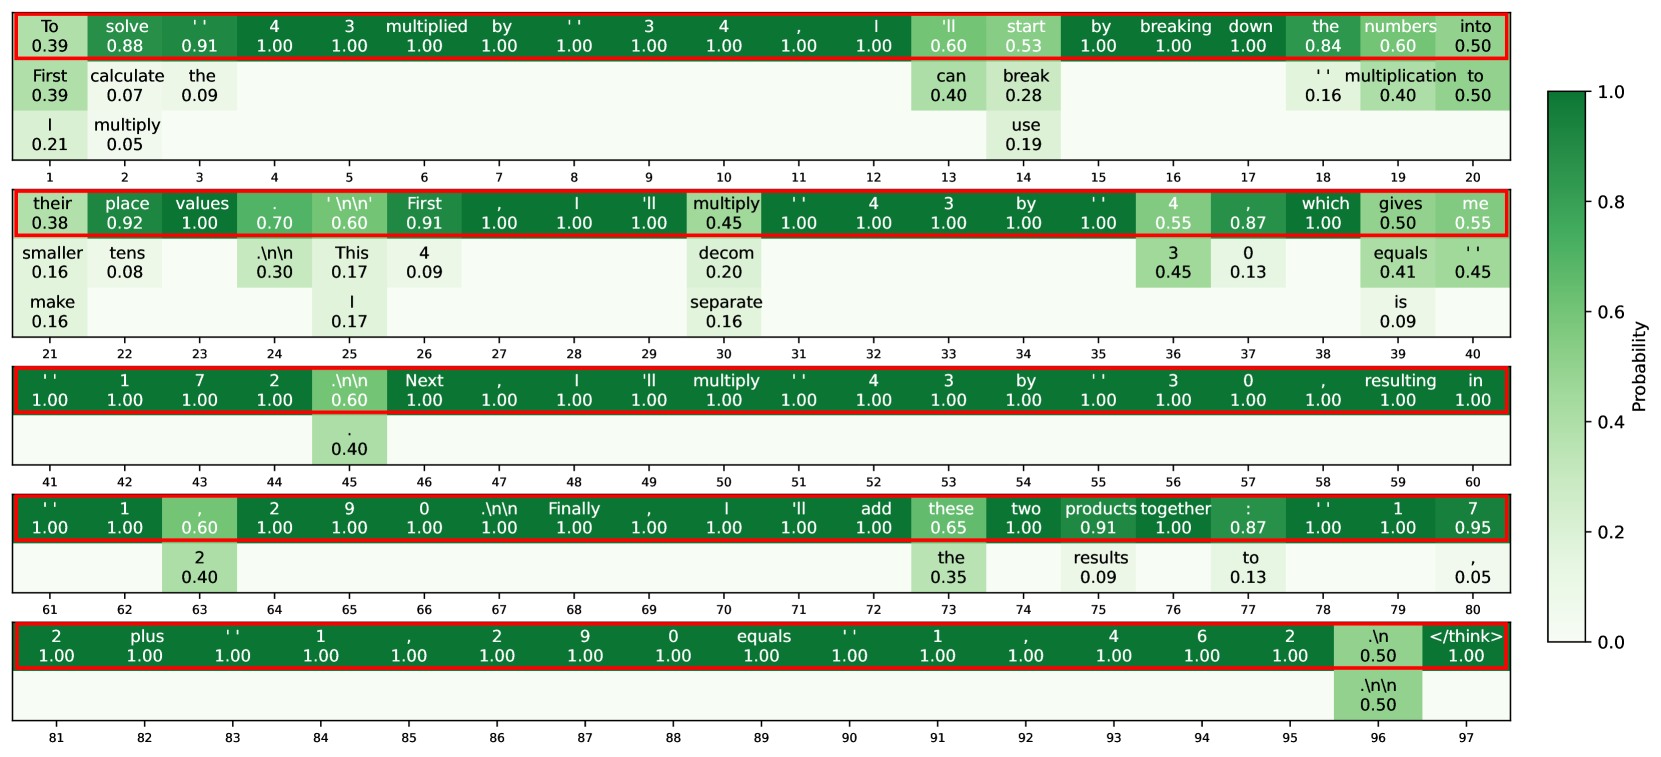
The image displays a heatmap visualizing the probability distribution of textual elements across a grid. Each cell contains a phrase or word fragment paired with a numerical probability value (0.0–1.0), represented by varying shades of green. Red borders highlight specific cells, suggesting emphasis on high-probability or critical elements. The heatmap appears to analyze linguistic patterns, potentially for code generation, natural language processing, or similar computational tasks.
### Components/Axes
- **Rows**: Labeled with textual phrases (e.g., "To solve 4 multiplied by 3", "First calculate the", "I multiply"). These represent sequential or contextual text segments.
- **Columns**: Labeled with individual words or symbols (e.g., "calculate", "the", "multiply", "by", "start"). These likely represent tokens or keywords.
- **Legend**: Positioned on the right, showing a gradient from light green (low probability, ~0.0) to dark green (high probability, ~1.0). No explicit title is provided.
- **Red Borders**: Highlight cells with probabilities ≥0.80, indicating strong associations or critical terms.
### Detailed Analysis
#### Row 1: "To solve 4 multiplied by 3"
- **Columns**:
- "solve" (0.88), "the" (0.91), "4" (1.00), "3" (1.00), "multiplied" (1.00), "by" (1.00), "start" (0.53), "break" (0.28), "use" (0.19), "numbers" (0.60), "into" (0.50), "multiplication" (0.40), "to" (0.50).
- **Key Observations**:
- High probabilities (1.00) for numerical values and operators ("4", "3", "multiplied", "by").
- Lower probabilities for contextual terms like "start" (0.53) and "break" (0.28).
#### Row 2: "First calculate the"
- **Columns**:
- "calculate" (0.07), "the" (0.09), "multiply" (0.45), "can" (0.40), "break" (0.28), "use" (0.19).
- **Key Observations**:
- Very low probabilities for "calculate" (0.07) and "the" (0.09), suggesting weak association with these terms in this context.
#### Row 3: "I multiply"
- **Columns**:
- "multiply" (0.17), "4" (0.09), "decom" (0.20), "separate" (0.16), "equals" (0.41), "is" (0.09).
- **Key Observations**:
- "multiply" (0.17) and "equals" (0.41) show moderate probabilities, while "4" (0.09) and "is" (0.09) are weakly associated.
#### Row 4: "their place values"
- **Columns**:
- "place" (0.92), "values" (1.00), "tens" (0.08), "decom" (0.20), "equals" (0.41).
- **Key Observations**:
- "values" (1.00) and "place" (0.92) are strongly associated, while "tens" (0.08) is weakly linked.
#### Row 5: "smaller make"
- **Columns**:
- "tens" (0.08), "separate" (0.16), "equals" (0.41), "is" (0.09).
- **Key Observations**:
- "separate" (0.16) and "equals" (0.41) show moderate probabilities, while "tens" (0.08) and "is" (0.09) are weakly associated.
#### Row 6: "1 7 2 .n/n Next"
- **Columns**:
- "1" (1.00), "7" (1.00), "2" (1.00), "n/n" (0.60), "Next" (1.00), "resulting" (1.00), "in" (1.00).
- **Key Observations**:
- Numerical values ("1", "7", "2") and "Next" (1.00) have maximum probabilities, indicating strong contextual relevance.
#### Row 7: "1 , 2 9"
- **Columns**:
- "1" (1.00), "2" (0.60), "9" (1.00), "add" (1.00), "these" (0.65), "products" (0.91), "together" (1.00).
- **Key Observations**:
- "1" and "9" (1.00) are strongly associated, while "2" (0.60) and "these" (0.65) show moderate probabilities.
#### Row 8: "2"
- **Columns**:
- "2" (0.40), "the" (0.35), "results" (0.09), "to" (0.13).
- **Key Observations**:
- "2" (0.40) has a moderate probability, while "the" (0.35) and "results" (0.09) are weakly associated.
#### Row 9: "2 plus 1"
- **Columns**:
- "2" (1.00), "plus" (1.00), "1" (1.00), "equals" (1.00).
- **Key Observations**:
- All terms ("2", "plus", "1", "equals") have maximum probabilities, indicating a high-confidence arithmetic operation.
#### Row 10: "2 .n /think>"
- **Columns**:
- "2" (1.00), "n" (0.50), "think" (1.00).
- **Key Observations**:
- "2" (1.00) and "think" (1.00) are strongly associated, while "n" (0.50) shows moderate probability.
### Key Observations
1. **High-Probability Clusters**:
- Numerical values (e.g., "4", "3", "1", "2", "9") and operators ("multiply", "plus", "equals") consistently show probabilities of 1.00, suggesting deterministic associations in computational contexts.
- Red-bordered cells (e.g., "multiply" in Row 1, "equals" in Row 9) highlight critical terms for task execution.
2. **Contextual Weaknesses**:
- Pronouns ("I", "their") and abstract terms ("place", "values") exhibit lower probabilities (e.g., "I" at 0.21, "their" at 0.38), indicating less determinism in natural language processing tasks.
3. **Red Border Significance**:
- Cells with probabilities ≥0.80 (e.g., "multiply" in Row 1, "equals" in Row 9) are emphasized, likely representing pivotal terms in code generation or logical operations.
### Interpretation
This heatmap likely models the likelihood of textual elements appearing in a computational or mathematical context. The high probabilities for numerical values and operators suggest a focus on arithmetic operations or code syntax. The red borders may indicate terms critical for task completion (e.g., "multiply", "equals"). The presence of phrases like "Next" and "resulting in" implies sequential reasoning, while lower probabilities for pronouns and abstract terms highlight challenges in natural language understanding. The structure resembles a tokenization or attention mechanism in NLP models, where specific tokens are prioritized based on context. The data underscores the interplay between deterministic computational logic and probabilistic natural language patterns.