## 3D Surface Plot: True ∞ - FE vs. x1 and x2
### Overview
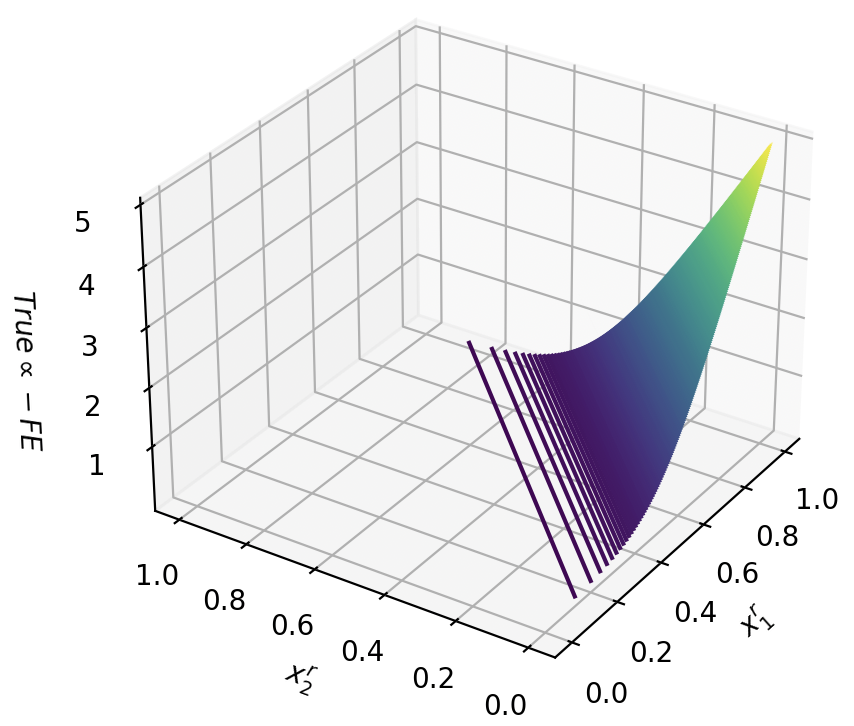
The image is a 3D surface plot visualizing the relationship between two independent variables, x1 and x2, and a dependent variable represented as "True ∞ - FE". The surface shows a curved shape, with values generally increasing as both x1 and x2 increase. There are also vertical lines that appear to be projections from the x1-x2 plane onto the surface.
### Components/Axes
* **X-axis (x1):** Ranges from 0.0 to 1.0 in increments of 0.2.
* **Y-axis (x2):** Ranges from 0.0 to 1.0 in increments of 0.2.
* **Z-axis (True ∞ - FE):** Ranges from 1 to 5 in increments of 1.
* **Surface Color:** The surface is colored with a gradient, transitioning from dark blue/purple at lower values to yellow/green at higher values. This color gradient visually represents the magnitude of "True ∞ - FE".
### Detailed Analysis
* **Surface Shape:** The surface starts relatively flat near the origin (x1=0, x2=0) and then curves upwards, indicating that "True ∞ - FE" increases more rapidly as x1 and x2 increase.
* **Vertical Lines:** There are several vertical lines projecting from the x1-x2 plane onto the surface. These lines appear to originate from specific points along the x1-axis, with x2=0. The lines connect the x1-x2 plane to the corresponding "True ∞ - FE" value on the surface.
* **Data Points:**
* At x1=0, x2=0, True ∞ - FE is approximately 1.
* At x1=1, x2=0, True ∞ - FE is approximately 3.
* At x1=0, x2=1, True ∞ - FE is approximately 3.
* At x1=1, x2=1, True ∞ - FE is approximately 5.
* **Trend:** The value of "True ∞ - FE" increases as both x1 and x2 increase. The rate of increase appears to be non-linear, with a steeper slope at higher values of x1 and x2.
### Key Observations
* The surface plot demonstrates a positive correlation between "True ∞ - FE" and both x1 and x2.
* The vertical lines provide a visual connection between the x1-x2 plane and the corresponding values on the surface.
* The color gradient enhances the visualization, making it easier to identify regions of high and low values for "True ∞ - FE".
### Interpretation
The plot visualizes a function where the output ("True ∞ - FE") is dependent on two input variables (x1 and x2). The curved surface suggests a non-linear relationship, possibly indicating an interaction effect between x1 and x2. The vertical lines could represent specific data points or simulations where x2 is held constant at 0, and x1 is varied. The increasing trend suggests that higher values of x1 and x2 lead to higher values of "True ∞ - FE". The nature of "True ∞ - FE" is not clear from the image alone, but it could represent an error metric, a performance measure, or any other quantity that depends on x1 and x2.