## 3D Surface Plot: Relationship Between x₁, x₂, and True α - FE
### Overview
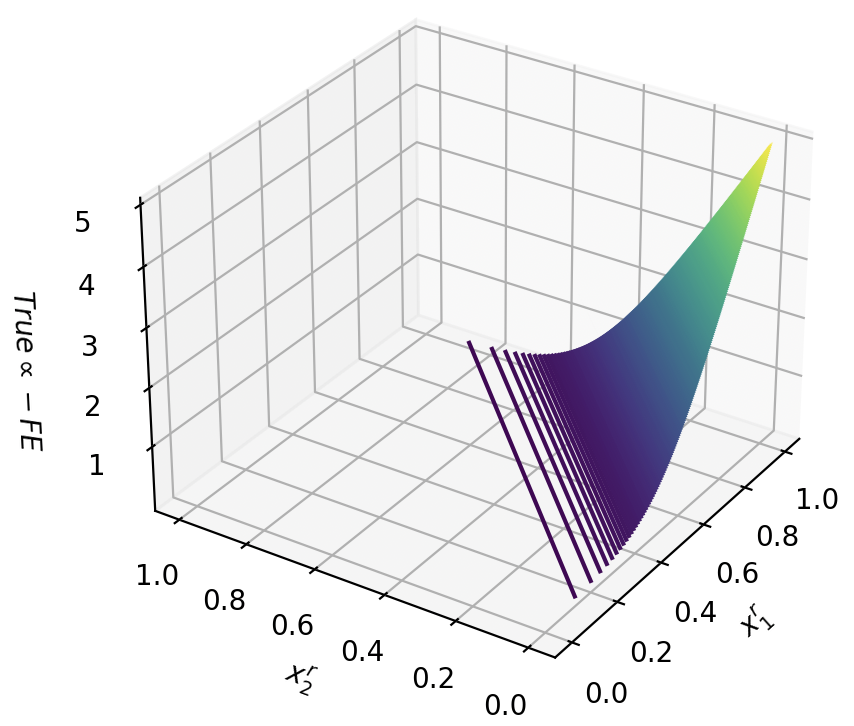
The image depicts a 3D surface plot visualizing the relationship between two input variables (x₁ and x₂) and a response variable labeled "True α - FE." The plot features a color gradient transitioning from purple (low values) to green (high values), with a distinct upward-curving surface originating from the origin (0,0,0) and peaking at (1,1,5). Grid lines define the 3D coordinate system, and the axes are labeled with numerical scales.
---
### Components/Axes
- **X-axis (x₁)**: Labeled "x₁" with a scale from 0.0 to 1.0 in increments of 0.2.
- **Y-axis (x₂)**: Labeled "x₂" with a scale from 0.0 to 1.0 in increments of 0.2.
- **Z-axis (True α - FE)**: Labeled "True α - FE" with a scale from 0 to 5 in increments of 1.
- **Surface**: A smooth, curved surface with a color gradient from purple (low values) to green (high values).
- **Grid Lines**: Gray grid lines define the 3D coordinate system on all three planes.
- **Color Gradient**: Implicit legend where purple represents low values (~0–2) and green represents high values (~3–5).
---
### Detailed Analysis
1. **Surface Shape**:
- The surface begins flat near the origin (0,0,0) and gradually curves upward as x₁ and x₂ increase.
- The curvature intensifies toward the upper-right corner (x₁=1.0, x₂=1.0), where the surface peaks at a height of 5 on the z-axis.
- Vertical lines of constant True α - FE are visible along the surface, indicating fixed z-values for specific (x₁, x₂) pairs.
2. **Color Gradient**:
- The gradient transitions from purple (darkest) at the base of the surface to green (brightest) at the peak.
- Intermediate values (e.g., ~2.5) are represented by blue tones.
3. **Key Data Points**:
- **Origin (0,0,0)**: Surface starts at z=0.
- **Midpoint (0.5,0.5,2.5)**: Approximate midpoint of the surface with a z-value of ~2.5 (blue tone).
- **Peak (1,1,5)**: Maximum z-value of 5 at (x₁=1.0, x₂=1.0), colored green.
---
### Key Observations
1. **Positive Correlation**: True α - FE increases monotonically with both x₁ and x₂, with the steepest rise occurring near (x₁=1.0, x₂=1.0).
2. **Smooth Gradient**: The color transition aligns with the surface height, confirming that higher z-values correspond to greener regions.
3. **No Outliers**: The surface is continuous and smooth, with no abrupt changes or discontinuities.
---
### Interpretation
The plot demonstrates a **nonlinear relationship** between x₁, x₂, and True α - FE, where the response variable grows quadratically as both inputs approach their maximum values. The color gradient provides an intuitive visualization of magnitude, emphasizing that the highest values of True α - FE are concentrated near the upper-right corner of the plot. This suggests that maximizing x₁ and x₂ simultaneously yields the greatest impact on True α - FE, which could be critical for optimization or sensitivity analysis in the underlying system. The absence of noise or outliers implies a deterministic relationship, potentially useful for modeling or predictive purposes.