## Line Chart: Average Incorrect Flips vs. Iteration
### Overview
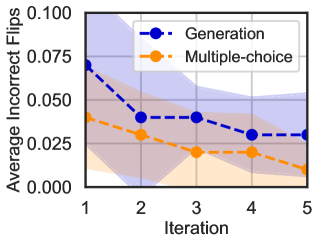
The image is a line chart comparing the average incorrect flips for two methods, "Generation" and "Multiple-choice," across five iterations. The chart displays the trend of incorrect flips decreasing with increasing iterations for both methods. Shaded regions around each line indicate the variability or uncertainty associated with the data.
### Components/Axes
* **Y-axis:** "Average Incorrect Flips," ranging from 0.000 to 0.100.
* Axis markers: 0.000, 0.025, 0.050, 0.075, 0.100
* **X-axis:** "Iteration," ranging from 1 to 5.
* Axis markers: 1, 2, 3, 4, 5
* **Legend:** Located in the top-right corner.
* "Generation": Represented by a blue dashed line with circular markers.
* "Multiple-choice": Represented by an orange dashed line with circular markers.
### Detailed Analysis
* **Generation (Blue Dashed Line):**
* Trend: Decreasing trend.
* Iteration 1: Approximately 0.072
* Iteration 2: Approximately 0.042
* Iteration 3: Approximately 0.042
* Iteration 4: Approximately 0.028
* Iteration 5: Approximately 0.032
* **Multiple-choice (Orange Dashed Line):**
* Trend: Decreasing trend.
* Iteration 1: Approximately 0.042
* Iteration 2: Approximately 0.032
* Iteration 3: Approximately 0.022
* Iteration 4: Approximately 0.018
* Iteration 5: Approximately 0.012
### Key Observations
* The "Generation" method starts with a higher average of incorrect flips compared to the "Multiple-choice" method.
* Both methods show a decrease in average incorrect flips as the iteration number increases.
* The "Generation" method has a steeper initial decline in incorrect flips compared to the "Multiple-choice" method.
* The shaded regions indicate the variability in the data, with the "Generation" method showing more variability, especially in the earlier iterations.
### Interpretation
The chart suggests that both "Generation" and "Multiple-choice" methods improve with more iterations, as indicated by the decreasing average incorrect flips. The "Generation" method, although initially less accurate, shows a significant improvement over iterations. The "Multiple-choice" method starts with better accuracy and maintains a relatively lower error rate throughout the iterations. The shaded regions highlight the consistency of the "Multiple-choice" method compared to the "Generation" method, which has more variability. This could indicate that the "Generation" method is more sensitive to the specific data or conditions of each iteration.