\n
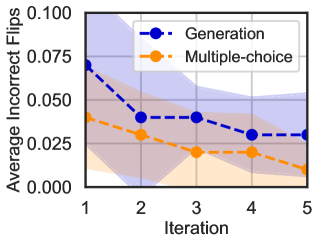
## Line Chart: Average Incorrect Flips vs. Iteration
### Overview
This image presents a line chart comparing the average number of incorrect flips over five iterations for two methods: "Generation" and "Multiple-choice". The chart includes shaded regions representing the variance or confidence interval around each line.
### Components/Axes
* **X-axis:** Iteration, ranging from 1 to 5.
* **Y-axis:** Average Incorrect Flips, ranging from 0.000 to 0.100.
* **Data Series 1:** "Generation" - Represented by a dashed blue line with filled blue circles as markers.
* **Data Series 2:** "Multiple-choice" - Represented by a dashed orange line with filled orange circles as markers.
* **Legend:** Located in the top-right corner, associating colors with the methods.
* **Shaded Regions:** A light blue shaded region surrounds the "Generation" line, and a light orange shaded region surrounds the "Multiple-choice" line. These likely represent standard deviation or confidence intervals.
### Detailed Analysis
**Generation (Blue Line):**
The blue line shows a decreasing trend from Iteration 1 to Iteration 5.
* Iteration 1: Approximately 0.077
* Iteration 2: Approximately 0.045
* Iteration 3: Approximately 0.035
* Iteration 4: Approximately 0.030
* Iteration 5: Approximately 0.025
**Multiple-choice (Orange Line):**
The orange line also shows a decreasing trend, but it starts at a lower value and has a less pronounced decrease than the blue line.
* Iteration 1: Approximately 0.035
* Iteration 2: Approximately 0.025
* Iteration 3: Approximately 0.015
* Iteration 4: Approximately 0.010
* Iteration 5: Approximately 0.005
The shaded regions indicate the variability around each line. The blue shaded region is wider, suggesting greater variance in the "Generation" method. The orange shaded region is narrower, indicating less variance in the "Multiple-choice" method.
### Key Observations
* Both methods show a decrease in average incorrect flips as the iteration number increases, indicating improvement in performance.
* The "Generation" method consistently has a higher average incorrect flip rate than the "Multiple-choice" method across all iterations.
* The variance in the "Generation" method is notably higher than in the "Multiple-choice" method.
* The rate of decrease in incorrect flips appears to slow down after Iteration 3 for both methods.
### Interpretation
The chart suggests that both the "Generation" and "Multiple-choice" methods improve with each iteration, as evidenced by the decreasing trend in incorrect flips. However, the "Multiple-choice" method consistently outperforms the "Generation" method, exhibiting a lower error rate throughout the five iterations. The larger shaded region around the "Generation" line indicates that the results for this method are more variable, potentially suggesting that its performance is more sensitive to initial conditions or other factors.
The slowing rate of decrease after Iteration 3 could indicate that the methods are approaching a performance limit, or that further improvements require more significant changes to the underlying algorithms or parameters. The data suggests that, for this particular task, the "Multiple-choice" approach is more reliable and consistent than the "Generation" approach. Further investigation could explore the reasons for the higher variance in the "Generation" method and identify strategies to reduce it.