\n
## Line Chart: Average Incorrect Flips Over Iterations
### Overview
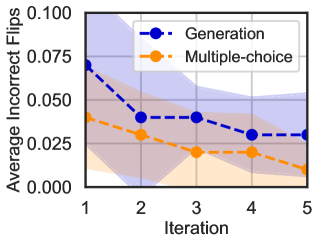
The image is a line chart comparing the performance of two methods, "Generation" and "Multiple-choice," across five iterations. The performance metric is "Average Incorrect Flips," where a lower value indicates better performance. Both methods show a decreasing trend, indicating improvement over time.
### Components/Axes
* **Chart Type:** Line chart with shaded confidence intervals (or standard deviation bands).
* **X-Axis (Horizontal):**
* **Label:** "Iteration"
* **Scale:** Discrete, linear scale from 1 to 5.
* **Markers:** Ticks at integers 1, 2, 3, 4, 5.
* **Y-Axis (Vertical):**
* **Label:** "Average Incorrect Flips"
* **Scale:** Linear scale from 0.000 to 0.100.
* **Markers:** Ticks at 0.000, 0.025, 0.050, 0.075, 0.100.
* **Legend:**
* **Position:** Top-right corner of the plot area.
* **Series 1:** "Generation" - Represented by a dark blue dashed line with circular markers.
* **Series 2:** "Multiple-choice" - Represented by an orange dashed line with circular markers.
* **Data Series & Shading:**
* Each line is accompanied by a semi-transparent shaded area of the same color, extending above and below the line. This likely represents a measure of variance (e.g., standard deviation, confidence interval).
### Detailed Analysis
**Trend Verification & Data Points (Approximate Values):**
1. **Generation (Blue Dashed Line):**
* **Visual Trend:** Starts high, experiences a sharp decrease between iterations 1 and 2, then continues a more gradual decline through iteration 5.
* **Data Points:**
* Iteration 1: ~0.070
* Iteration 2: ~0.040
* Iteration 3: ~0.040
* Iteration 4: ~0.030
* Iteration 5: ~0.030
* **Shading:** The blue shaded band is widest at iteration 1 (spanning approx. 0.050 to 0.090) and narrows considerably by iteration 5.
2. **Multiple-choice (Orange Dashed Line):**
* **Visual Trend:** Starts lower than Generation and shows a steady, consistent downward slope across all five iterations.
* **Data Points:**
* Iteration 1: ~0.040
* Iteration 2: ~0.030
* Iteration 3: ~0.020
* Iteration 4: ~0.020
* Iteration 5: ~0.010
* **Shading:** The orange shaded band is relatively consistent in width across iterations, spanning roughly ±0.015 from the central line.
### Key Observations
* **Performance Gap:** The "Multiple-choice" method consistently has a lower "Average Incorrect Flips" value than the "Generation" method at every iteration.
* **Rate of Improvement:** "Generation" shows a more dramatic initial improvement (a drop of ~0.030 between iterations 1 and 2) compared to the steadier improvement of "Multiple-choice."
* **Convergence:** By iteration 5, the performance gap between the two methods has narrowed compared to iteration 1, but "Multiple-choice" remains superior.
* **Variance:** The "Generation" method exhibits much higher variance (wider shaded area) in the early iterations, suggesting less consistent performance initially. Its variance decreases significantly over time. The "Multiple-choice" method shows more stable variance throughout.
### Interpretation
The chart demonstrates that both evaluated methods improve their accuracy (reduce incorrect flips) with repeated iterations. The "Multiple-choice" approach is not only more accurate from the outset but also maintains a more consistent performance (lower variance). The "Generation" approach starts with higher error and greater inconsistency but learns rapidly, particularly in the first step.
The data suggests a trade-off: "Multiple-choice" offers reliable, steady performance, while "Generation" may have a higher initial cost in errors but demonstrates a capacity for rapid early learning. The narrowing gap by iteration 5 indicates that with sufficient iterations, the performance of "Generation" approaches that of "Multiple-choice," though it does not surpass it within the observed timeframe. The investigation would benefit from knowing what happens beyond iteration 5 to see if the trends continue, plateau, or cross.