## Line Charts: Model Performance Across Shots
### Overview
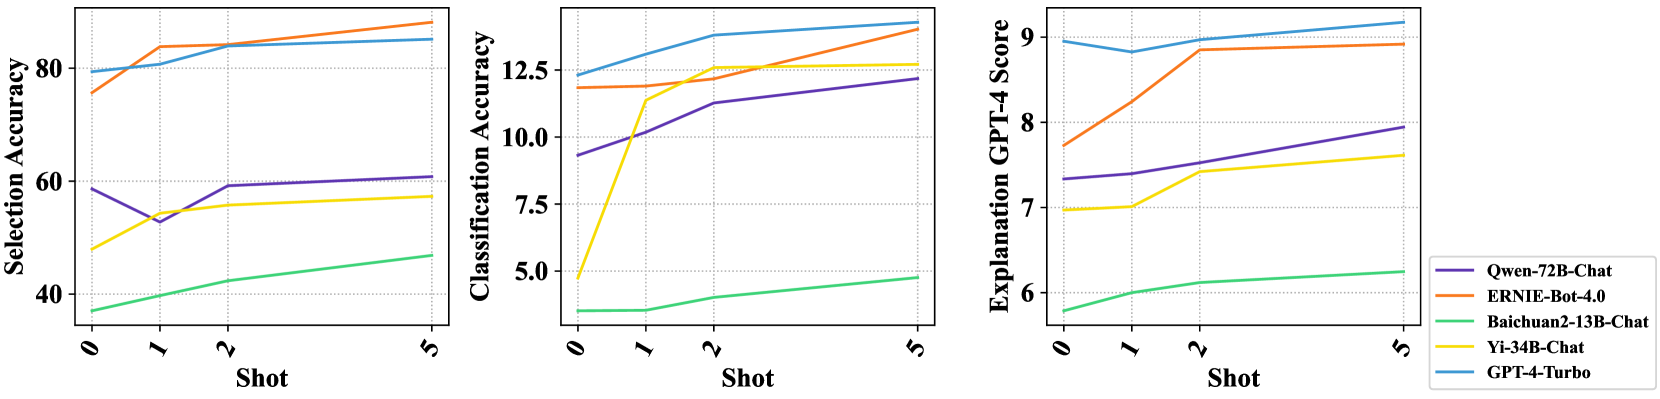
The image contains three side-by-side line charts comparing the performance of five AI models across three metrics: **Selection Accuracy**, **Classification Accuracy**, and **Explanation GPT-4 Score**. Each chart tracks performance across six "Shots" (0 to 5), with distinct color-coded lines representing different models. The charts emphasize trends in model capabilities as data availability increases.
---
### Components/Axes
1. **X-Axis (All Charts)**:
- Label: "Shot"
- Scale: 0 to 5 (discrete intervals).
2. **Y-Axes**:
- **Left Chart**: "Selection Accuracy" (40–80).
- **Middle Chart**: "Classification Accuracy" (5–12.5).
- **Right Chart**: "Explanation GPT-4 Score" (6–9).
3. **Legend**:
- Position: Right side of all charts.
- Models:
- Purple: Qwen-72B-Chat
- Orange: ERNIE-Bot-4.0
- Green: Baichuan2-13B-Chat
- Yellow: Yi-34B-Chat
- Blue: GPT-4-Turbo
---
### Detailed Analysis
#### Chart 1: Selection Accuracy (40–80)
- **Trends**:
- **ERNIE-Bot-4.0 (Orange)**: Starts at ~75 (Shot 0), rises to ~80 (Shot 1), then plateaus at ~85 (Shot 5).
- **GPT-4-Turbo (Blue)**: Begins at ~80 (Shot 0), increases to ~82 (Shot 1), then stabilizes at ~85 (Shot 5).
- **Qwen-72B-Chat (Purple)**: Drops from ~60 (Shot 0) to ~50 (Shot 1), then recovers to ~60 (Shot 5).
- **Yi-34B-Chat (Yellow)**: Starts at ~45 (Shot 0), rises to ~55 (Shot 1), then plateaus at ~58 (Shot 5).
- **Baichuan2-13B-Chat (Green)**: Gradually increases from ~35 (Shot 0) to ~40 (Shot 1), then ~45 (Shot 5).
#### Chart 2: Classification Accuracy (5–12.5)
- **Trends**:
- **Yi-34B-Chat (Yellow)**: Sharp rise from ~5 (Shot 0) to ~12 (Shot 1), then stabilizes at ~12.5 (Shot 5).
- **ERNIE-Bot-4.0 (Orange)**: Starts at ~12 (Shot 0), dips to ~11.5 (Shot 1), then rises to ~13 (Shot 5).
- **GPT-4-Turbo (Blue)**: Begins at ~12.5 (Shot 0), increases to ~13 (Shot 1), then plateaus at ~13.5 (Shot 5).
- **Qwen-72B-Chat (Purple)**: Rises from ~9 (Shot 0) to ~11 (Shot 1), then stabilizes at ~12 (Shot 5).
- **Baichuan2-13B-Chat (Green)**: Gradual increase from ~3 (Shot 0) to ~4 (Shot 1), then ~4.5 (Shot 5).
#### Chart 3: Explanation GPT-4 Score (6–9)
- **Trends**:
- **GPT-4-Turbo (Blue)**: Starts at ~9 (Shot 0), dips to ~8.8 (Shot 1), then rises to ~9.2 (Shot 5).
- **ERNIE-Bot-4.0 (Orange)**: Begins at ~7.5 (Shot 0), increases to ~8.5 (Shot 1), then plateaus at ~8.8 (Shot 5).
- **Qwen-72B-Chat (Purple)**: Rises from ~7.5 (Shot 0) to ~8 (Shot 1), then stabilizes at ~8.5 (Shot 5).
- **Yi-34B-Chat (Yellow)**: Gradual increase from ~7 (Shot 0) to ~7.5 (Shot 1), then ~8 (Shot 5).
- **Baichuan2-13B-Chat (Green)**: Slow rise from ~5.5 (Shot 0) to ~6 (Shot 1), then ~6.5 (Shot 5).
---
### Key Observations
1. **ERNIE-Bot-4.0 and GPT-4-Turbo** consistently outperform other models in **Selection Accuracy** and **Classification Accuracy**, with GPT-4-Turbo showing the highest stability.
2. **Yi-34B-Chat** demonstrates rapid improvement in **Classification Accuracy** (Shot 0 to 1) but plateaus afterward.
3. **Baichuan2-13B-Chat** exhibits the lowest performance across all metrics but shows steady incremental gains.
4. **Qwen-72B-Chat** underperforms in **Selection Accuracy** initially but improves in **Classification Accuracy** and **Explanation Scores**.
---
### Interpretation
The charts suggest that **GPT-4-Turbo** and **ERNIE-Bot-4.0** are the most robust models, excelling in both accuracy and explanation quality. **Yi-34B-Chat** shows promise in classification tasks but lacks consistency. **Baichuan2-13B-Chat** lags behind but may improve with more data (Shots). The **Qwen-72B-Chat** model’s performance is mixed, with strengths in explanation but weaknesses in selection tasks.
The data implies that model performance is highly dependent on the task type (selection vs. classification vs. explanation) and data availability (Shots). GPT-4-Turbo’s dominance in explanation scores aligns with its reputation for advanced reasoning capabilities.