\n
## Stacked Bar Chart: Word Ratio Distribution
### Overview
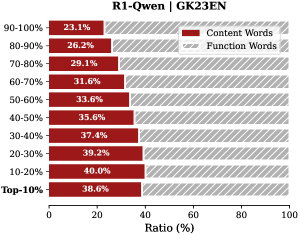
The image presents a stacked horizontal bar chart illustrating the ratio of "Content Words" to "Function Words" across different percentage ranges. The chart is titled "R1-Qwen | GK23EN" at the top-center. The x-axis represents the ratio in percentage, ranging from 0 to 100. The y-axis displays percentage ranges, from "Top >10%" to "90-100%". Each bar is divided into two sections: a dark red section representing "Content Words" and a light gray section representing "Function Words".
### Components/Axes
* **Title:** R1-Qwen | GK23EN
* **X-axis Label:** Ratio (%)
* **Y-axis Labels:** Top >10%, 10-20%, 20-30%, 30-40%, 40-50%, 50-60%, 60-70%, 70-80%, 80-90%, 90-100%
* **Legend:**
* Dark Red: Content Words
* Light Gray: Function Words
### Detailed Analysis
The chart displays the percentage of content words and function words within specified ratio ranges. The bars are stacked horizontally, with the content word percentage displayed on the left and the function word percentage filling the remainder of the bar.
Here's a breakdown of the data, reading from the bottom up:
* **Top >10%:** Content Words: ~38.6%, Function Words: ~61.4%
* **10-20%:** Content Words: ~40.0%, Function Words: ~60.0%
* **20-30%:** Content Words: ~39.2%, Function Words: ~60.8%
* **30-40%:** Content Words: ~37.4%, Function Words: ~62.6%
* **40-50%:** Content Words: ~35.6%, Function Words: ~64.4%
* **50-60%:** Content Words: ~33.6%, Function Words: ~66.4%
* **60-70%:** Content Words: ~31.6%, Function Words: ~68.4%
* **70-80%:** Content Words: ~29.1%, Function Words: ~70.9%
* **80-90%:** Content Words: ~26.2%, Function Words: ~73.8%
* **90-100%:** Content Words: ~23.1%, Function Words: ~76.9%
The trend shows a consistent decrease in the ratio of Content Words as the overall ratio increases, and a corresponding increase in the ratio of Function Words.
### Key Observations
* The proportion of Function Words consistently exceeds that of Content Words across all ratio ranges.
* The most significant difference between Content and Function Word ratios occurs in the highest ratio range (90-100%), where Function Words comprise approximately 76.9% of the total.
* The difference between the two word types is smallest in the 10-20% range, with Content Words at 40% and Function Words at 60%.
### Interpretation
This chart likely represents the linguistic composition of a text or corpus, labeled "R1-Qwen | GK23EN". The data suggests that this text is heavily dominated by function words (articles, prepositions, conjunctions, etc.) compared to content words (nouns, verbs, adjectives, etc.). This could indicate a highly grammatical or formal style of writing, or potentially a text focused on procedural instructions or technical documentation where functional language is prioritized. The decreasing ratio of content words as the overall ratio increases suggests that as the overall ratio of words increases, the proportion of function words becomes even more dominant. This could be due to the increasing need for grammatical structure and clarity as the complexity of the text grows. The specific labels "R1-Qwen" and "GK23EN" likely refer to a specific model or dataset used in the analysis.