\n
## Pie Chart: Majors and Loan Payment Status
### Overview
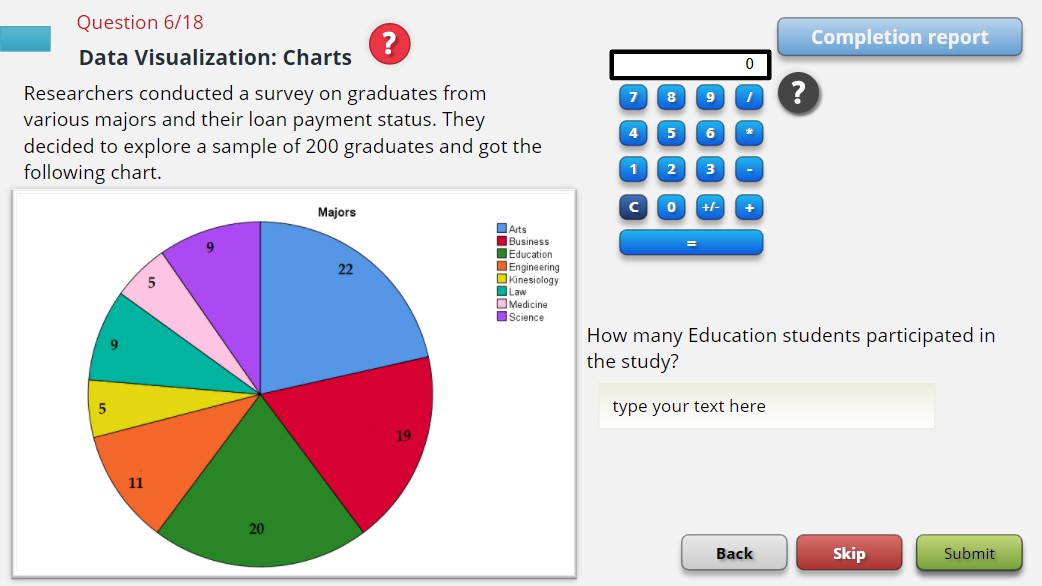
The image presents a pie chart illustrating the distribution of majors among 200 graduates surveyed regarding their loan payment status. The chart is part of a question within an educational context, likely a data visualization exercise. The question asks how many Education students participated in the study.
### Components/Axes
* **Title:** Majors
* **Total Sample Size:** 200 graduates
* **Legend:** Located in the top-right corner of the chart.
* Arts (Light Blue)
* Business (Blue)
* Education (Dark Blue)
* Engineering (Orange)
* Kinesiology (Yellow)
* Law (Red)
* Medicine (Pink)
* Science (Green)
* **Pie Chart Segments:** Each segment represents a major, with the number of graduates in that major displayed directly on the segment.
### Detailed Analysis
The pie chart segments and their corresponding values are as follows:
* **Arts:** 22 graduates (Light Blue)
* **Business:** 9 graduates (Blue)
* **Education:** 5 graduates (Dark Blue)
* **Engineering:** 9 graduates (Orange)
* **Kinesiology:** 5 graduates (Yellow)
* **Law:** 19 graduates (Red)
* **Medicine:** 20 graduates (Pink)
* **Science:** 11 graduates (Green)
The sum of these values is 200, confirming the total sample size.
### Key Observations
* Arts represents the largest proportion of the sample (22/200 = 11%).
* Education and Kinesiology have the smallest representation (5/200 = 2.5%).
* Medicine and Law have relatively high representation (19 and 20 respectively).
### Interpretation
The data suggests that Arts is the most common major among the surveyed graduates, while Education and Kinesiology are the least common. This distribution could reflect the overall popularity of these majors within the population from which the sample was drawn. The question posed ("How many Education students participated in the study?") can be directly answered from the chart: 5 Education students participated. The presence of a calculator and input field suggests this is an interactive learning module where the user is expected to extract the information and provide the answer. The "Completion report" button indicates a tracking mechanism for user progress. The question is designed to test the ability to read and interpret a pie chart and extract specific data points.