\n
## Scatter Plot: Accuracy vs. Time-to-Answer
### Overview
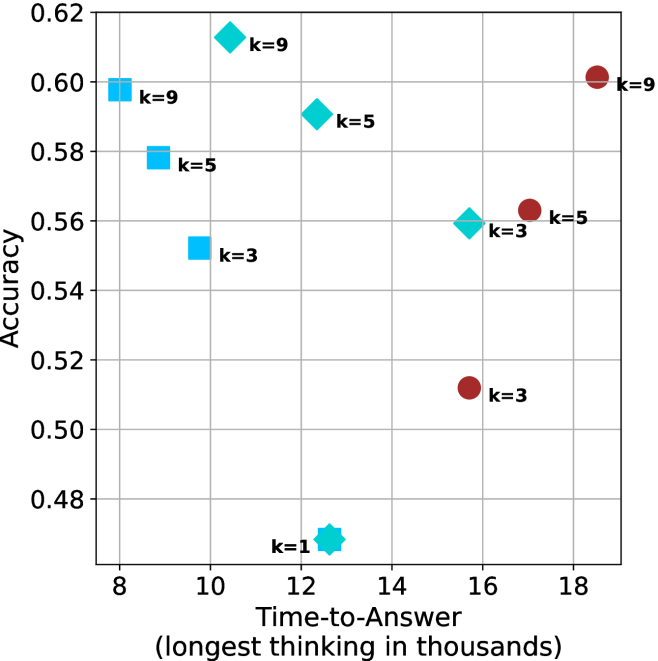
This image presents a scatter plot illustrating the relationship between Accuracy and Time-to-Answer, with data points differentiated by the value of 'k'. The x-axis represents Time-to-Answer in thousands of units, and the y-axis represents Accuracy. There are two distinct marker shapes: squares and circles, each representing different values of 'k'.
### Components/Axes
* **X-axis:** Time-to-Answer (longest thinking in thousands) - Scale ranges from approximately 8 to 19.
* **Y-axis:** Accuracy - Scale ranges from approximately 0.48 to 0.62.
* **Legend:** Implicitly defined by marker shape and 'k' value labels next to the data points.
* **Data Series:** Two distinct series based on marker shape.
* Squares: Representing k = 1, 3, 5, and 9.
* Circles: Representing k = 3, 5, and 9.
* **'k' Values:** 1, 3, 5, and 9.
### Detailed Analysis
The plot shows a general trend of increasing accuracy with increasing time-to-answer. Let's analyze each 'k' value series:
* **k = 1 (Square, Cyan):** Located at approximately (13.5, 0.49).
* **k = 3 (Square, Blue):** Located at approximately (9.5, 0.55) and (15.5, 0.51).
* **k = 5 (Square, Light Blue):** Located at approximately (10.5, 0.59) and (17.5, 0.56).
* **k = 9 (Square, Dark Blue):** Located at approximately (9, 0.60) and (14, 0.61).
* **k = 3 (Circle, Red):** Located at approximately (16, 0.52).
* **k = 5 (Circle, Red):** Located at approximately (18, 0.56).
* **k = 9 (Circle, Red):** Located at approximately (18, 0.60).
The square markers generally cluster towards the left side of the plot (lower Time-to-Answer values), while the circle markers are more dispersed and tend towards the right side (higher Time-to-Answer values).
### Key Observations
* There is a positive correlation between Time-to-Answer and Accuracy.
* For k=3, k=5, and k=9, there are data points represented by both square and circle markers, suggesting potentially different behaviors or conditions for the same 'k' value.
* The highest accuracy values (around 0.60) are achieved with k=9, and these points are associated with longer Time-to-Answer values.
* k=1 has the lowest accuracy and a moderate Time-to-Answer.
* There is some overlap in the Time-to-Answer ranges for different 'k' values, particularly for k=3, k=5, and k=9.
### Interpretation
This data suggests that increasing the 'thinking time' (Time-to-Answer) generally leads to higher accuracy. The parameter 'k' appears to influence both the accuracy and the time required to achieve it. The presence of both square and circle markers for k=3, k=5, and k=9 indicates that there might be different strategies or conditions under which the system operates, leading to variations in performance for the same 'k' value. The fact that the circle markers generally have higher Time-to-Answer values suggests that these conditions might involve more complex or time-consuming processing. The plot could be illustrating the trade-off between speed and accuracy in a decision-making process, where 'k' represents a parameter controlling the complexity or thoroughness of the process. The differing shapes for the same 'k' value could represent different algorithms or approaches being tested. Further investigation would be needed to understand the specific meaning of 'k' and the conditions that lead to the different marker shapes.