## Scatter Plot: Accuracy vs. Time-to-Answer for Different k Values
### Overview
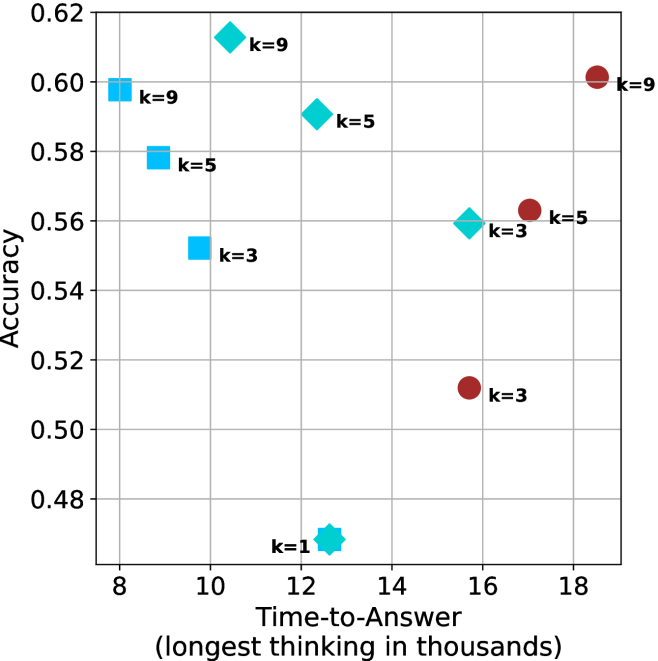
The image is a scatter plot comparing classification accuracy (y-axis) against time-to-answer (x-axis, in thousands of units) for three different k-values (k=3, k=5, k=9) in a machine learning model. A single outlier point (k=1) is also present. Data points are color-coded and shaped by k-value, with a legend on the right.
### Components/Axes
- **X-axis**: "Time-to-Answer (longest thinking in thousands)"
- Scale: 8 to 18 (discrete intervals)
- **Y-axis**: "Accuracy"
- Scale: 0.48 to 0.62 (continuous)
- **Legend**:
- **k=3**: Blue squares
- **k=5**: Teal diamonds
- **k=9**: Red circles
- **k=1**: Teal star (not in legend, but annotated)
### Detailed Analysis
#### Data Points by k-Value
1. **k=3 (Blue Squares)**
- (10, 0.54)
- (12, 0.56)
- (16, 0.51)
- **Trend**: Slight increase from 10→12, then sharp drop at 16.
2. **k=5 (Teal Diamonds)**
- (10, 0.58)
- (14, 0.56)
- (16, 0.53)
- **Trend**: Gradual decline as time increases.
3. **k=9 (Red Circles)**
- (8, 0.58)
- (10, 0.60)
- (18, 0.60)
- **Trend**: Slight improvement at 10, then plateau.
4. **k=1 (Teal Star)**
- (12, 0.48)
- **Note**: Outlier with lowest accuracy despite mid-range time.
### Key Observations
- **k=9 Dominates**: Highest accuracy (0.60) at both shortest (8) and longest (18) times.
- **k=1 Anomaly**: Significantly lower accuracy (0.48) than other k-values at similar time points.
- **Trade-off for k=3/5**: Accuracy decreases as time increases, suggesting diminishing returns.
- **Consistency in k=9**: Maintains high accuracy across all time points.
### Interpretation
The data suggests that higher k-values (e.g., k=9) improve model accuracy, particularly in longer-thinking scenarios, while lower k-values (k=3/5) show a trade-off between speed and precision. The k=1 outlier likely indicates overfitting or insufficient data for small k, as it underperforms despite moderate time investment. The plateau in k=9’s accuracy at longer times implies diminishing gains beyond a certain threshold. This pattern aligns with k-NN model behavior, where larger k reduces noise sensitivity but increases computational cost.