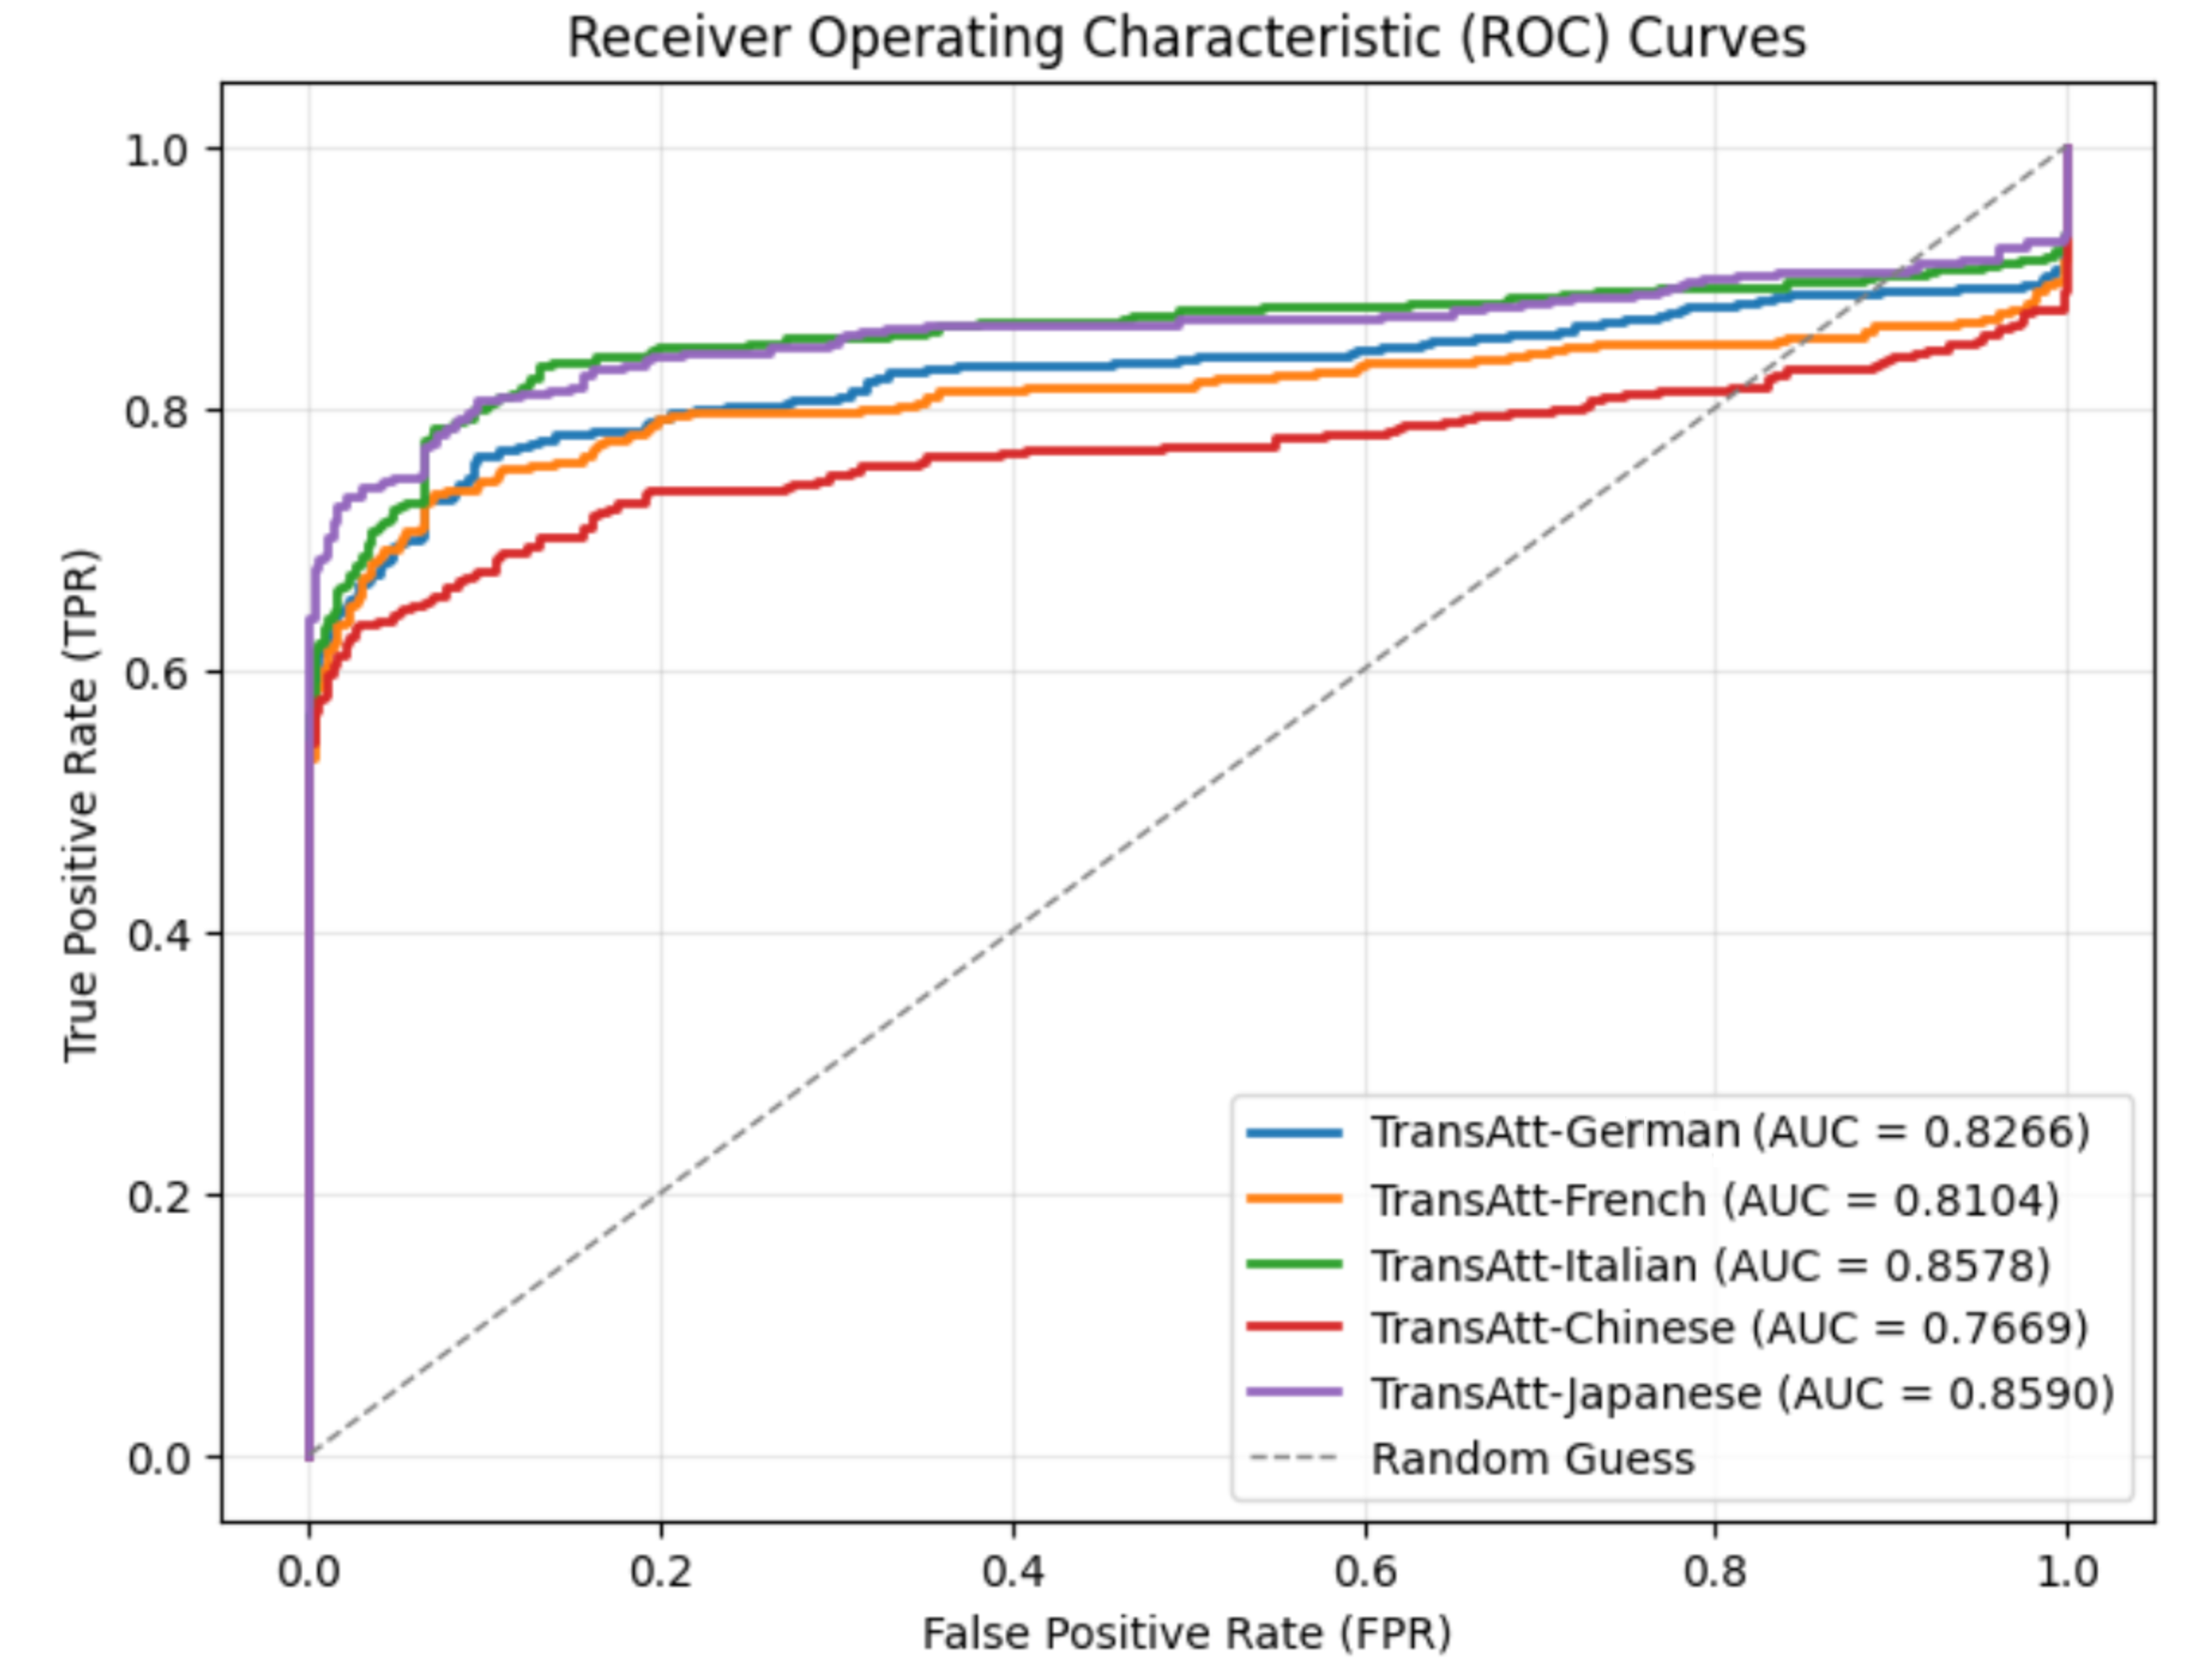
## Chart Type: ROC Curves
### Overview
The image is a Receiver Operating Characteristic (ROC) curve chart, comparing the performance of different language models (German, French, Italian, Chinese, and Japanese) against a random guess baseline. The chart plots the True Positive Rate (TPR) against the False Positive Rate (FPR). Each language model is represented by a different colored line, and the Area Under the Curve (AUC) is provided in the legend.
### Components/Axes
* **Title:** Receiver Operating Characteristic (ROC) Curves
* **X-axis:** False Positive Rate (FPR), ranging from 0.0 to 1.0 in increments of 0.2.
* **Y-axis:** True Positive Rate (TPR), ranging from 0.0 to 1.0 in increments of 0.2.
* **Legend (bottom-right):**
* Blue: TransAtt-German (AUC = 0.8266)
* Orange: TransAtt-French (AUC = 0.8104)
* Green: TransAtt-Italian (AUC = 0.8578)
* Red: TransAtt-Chinese (AUC = 0.7669)
* Purple: TransAtt-Japanese (AUC = 0.8590)
* Dashed Gray: Random Guess
### Detailed Analysis
* **TransAtt-German (Blue):** The line starts at approximately (0, 0.6), rises sharply, and then gradually increases to approximately (1, 0.92).
* **TransAtt-French (Orange):** The line starts at approximately (0, 0.6), rises sharply, and then gradually increases to approximately (1, 0.88).
* **TransAtt-Italian (Green):** The line starts at approximately (0, 0.7), rises sharply, and then gradually increases to approximately (1, 0.92).
* **TransAtt-Chinese (Red):** The line starts at approximately (0, 0.6), rises sharply, and then gradually increases to approximately (1, 0.88).
* **TransAtt-Japanese (Purple):** The line starts at approximately (0, 0), rises sharply to approximately (0, 0.7), and then gradually increases to approximately (1, 0.94).
* **Random Guess (Dashed Gray):** A diagonal line from (0, 0) to (1, 1).
### Key Observations
* The TransAtt-Japanese model (purple) has the highest AUC (0.8590), indicating the best performance among the language models.
* The TransAtt-Chinese model (red) has the lowest AUC (0.7669), indicating the worst performance among the language models.
* All language models outperform the random guess baseline.
* The ROC curves for all models show a steep initial rise, indicating a good ability to correctly classify positive instances at low false positive rates.
### Interpretation
The ROC curves visually represent the performance of different language models in a binary classification task. The AUC values provide a quantitative measure of the models' ability to distinguish between positive and negative instances. A higher AUC indicates better performance. The fact that all language models outperform the random guess baseline suggests that they are all effective to some extent. The TransAtt-Japanese model appears to be the most accurate, while the TransAtt-Chinese model is the least accurate among those tested. The steep initial rise in the ROC curves suggests that all models are good at identifying true positives without generating too many false positives, especially at lower thresholds.