## Chart: Receiver Operating Characteristic (ROC) Curves
### Overview
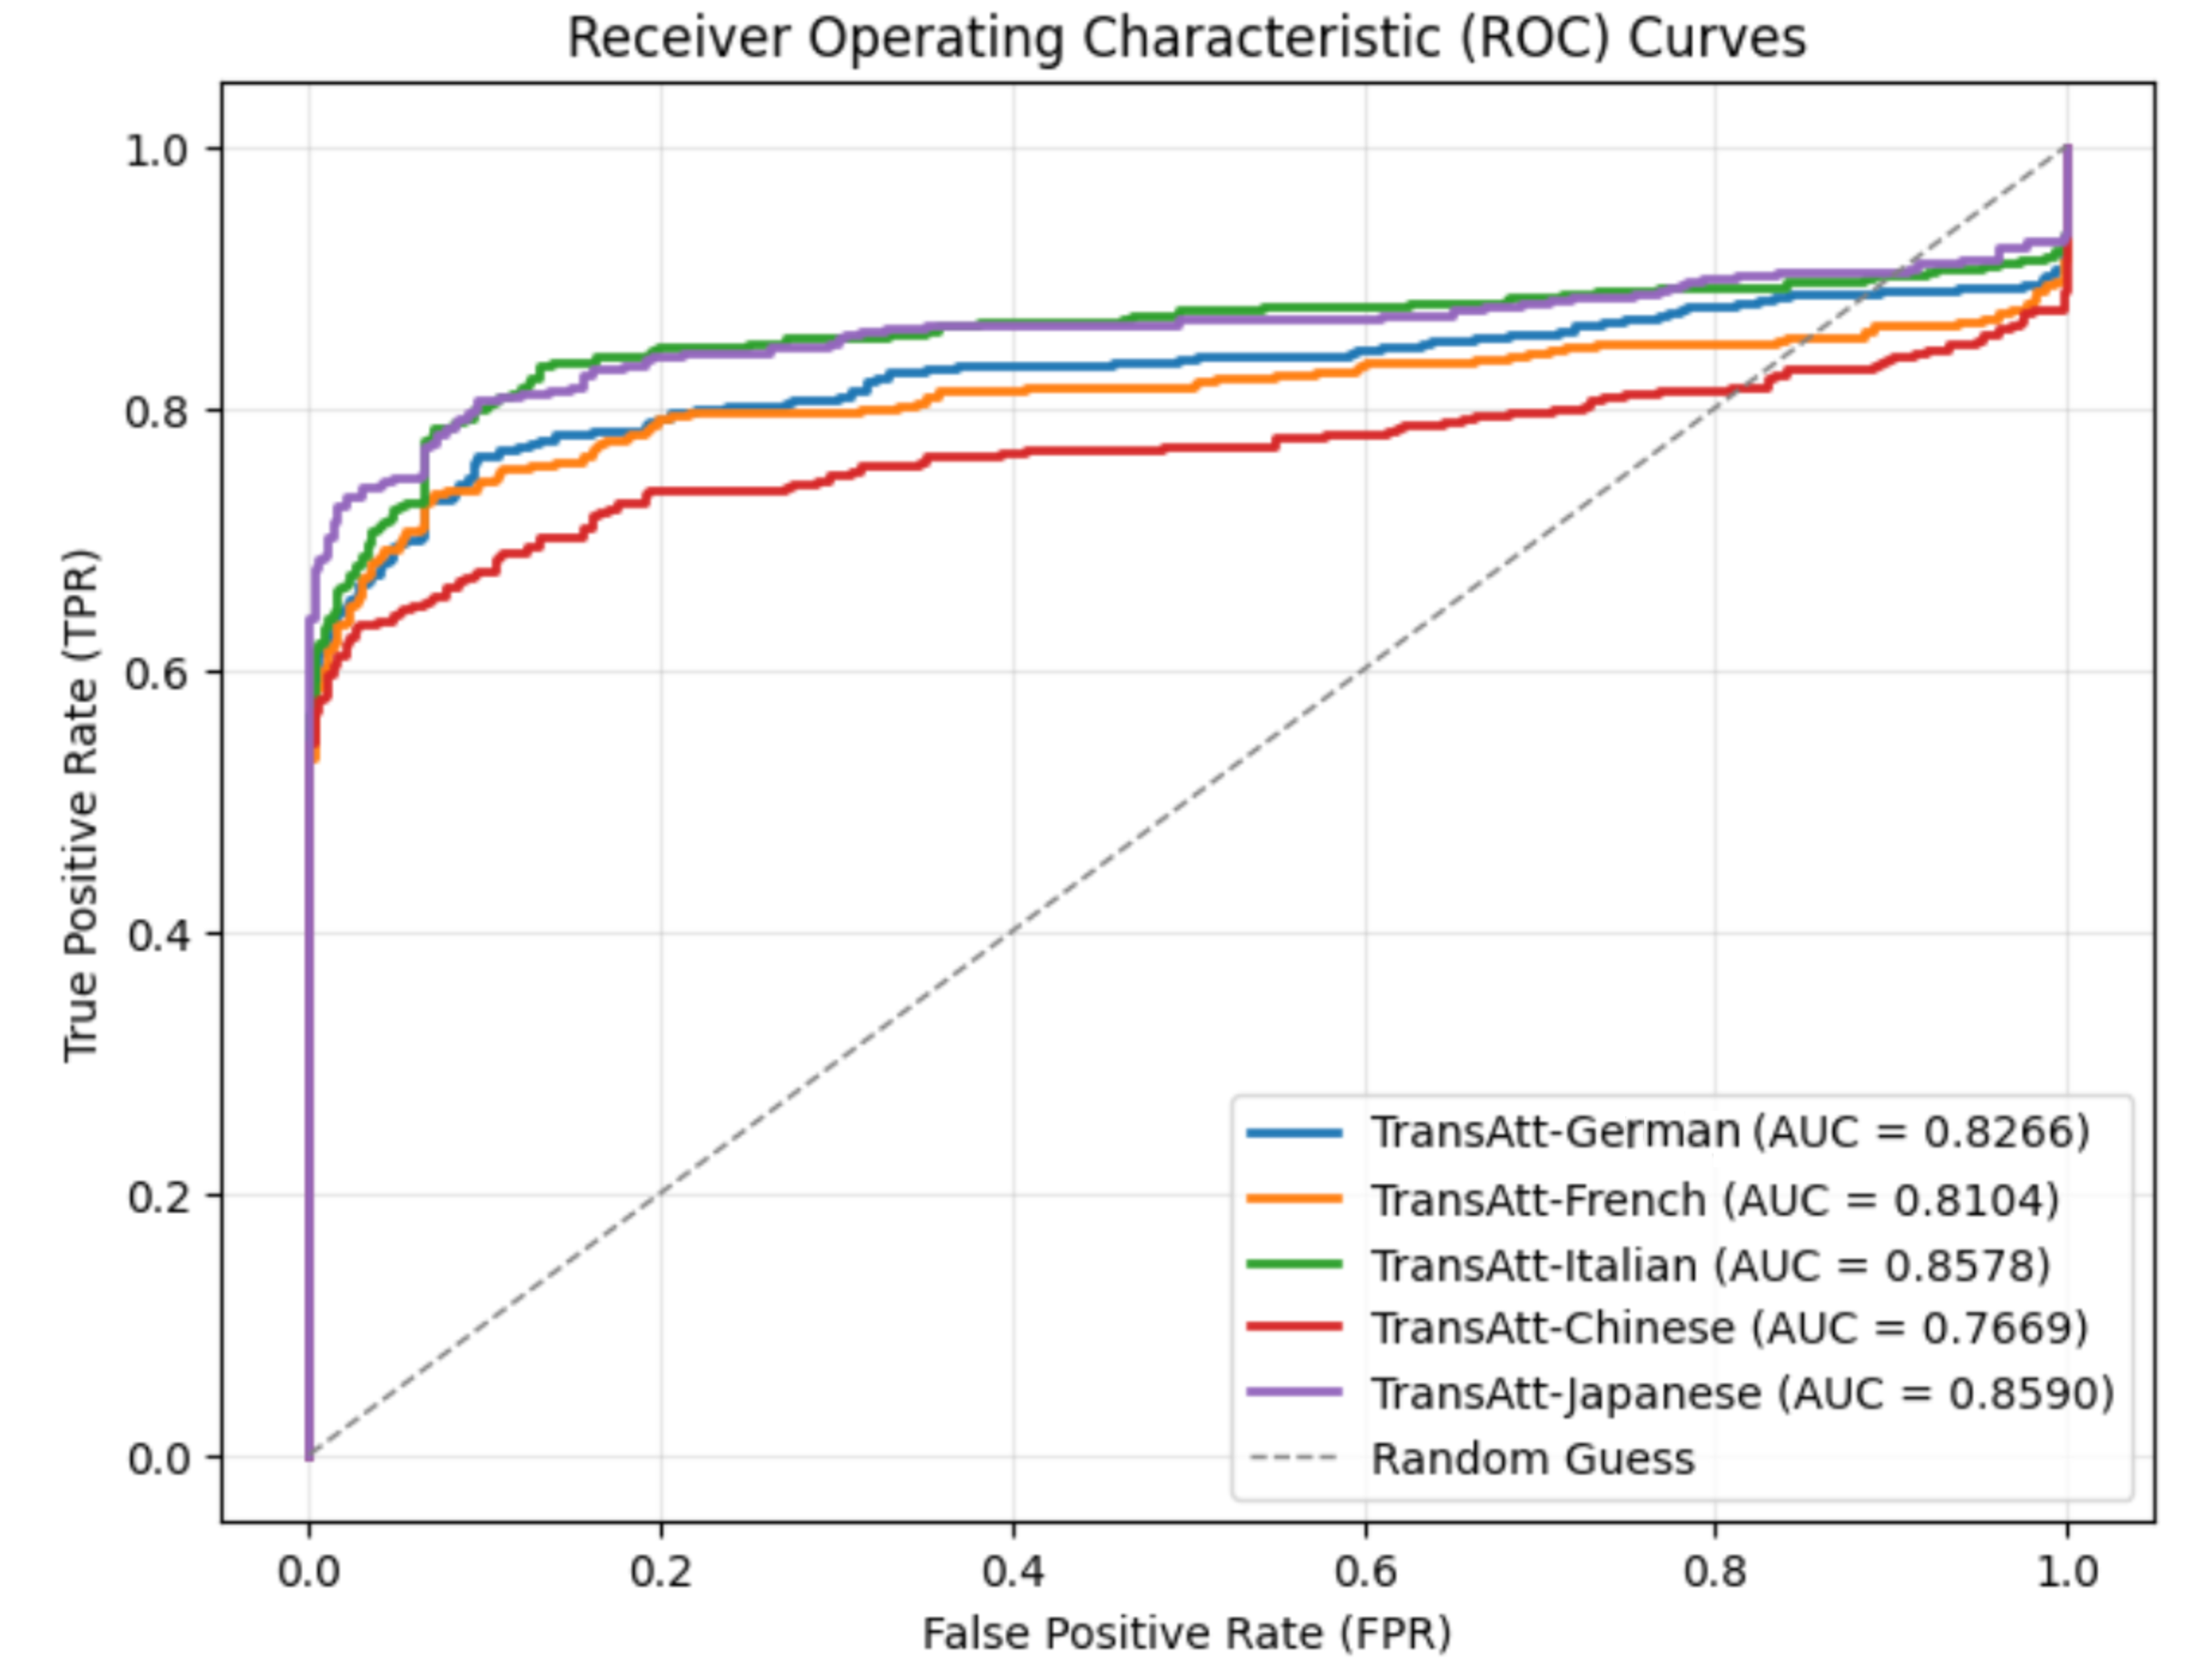
The image displays a Receiver Operating Characteristic (ROC) curve chart comparing the performance of a classification model (TransAtt) across five languages: German, French, Italian, Chinese, and Japanese. The chart evaluates the trade-off between the True Positive Rate (TPR) and False Positive Rate (FPR) for each language-specific model, with a dashed line representing a random guess baseline.
### Components/Axes
- **X-axis**: False Positive Rate (FPR), ranging from 0.0 to 1.0 in increments of 0.2.
- **Y-axis**: True Positive Rate (TPR), ranging from 0.0 to 1.0 in increments of 0.2.
- **Legend**: Located in the bottom-right corner, associating colors with languages and their Area Under the Curve (AUC) values:
- Blue: TransAtt-German (AUC = 0.8266)
- Orange: TransAtt-French (AUC = 0.8104)
- Green: TransAtt-Italian (AUC = 0.8578)
- Red: TransAtt-Chinese (AUC = 0.7669)
- Purple: TransAtt-Japanese (AUC = 0.8590)
- Dashed gray: Random Guess (no AUC provided).
### Detailed Analysis
1. **TransAtt-Japanese (Purple)**:
- Starts steeply, achieving high TPR early with minimal FPR.
- Maintains the highest TPR across all FPR values, peaking near 1.0 at FPR ~0.9.
- AUC = 0.8590 (highest among all languages).
2. **TransAtt-Italian (Green)**:
- Follows a similar upward trajectory to the Japanese curve but slightly below it.
- AUC = 0.8578, closely matching the Japanese model.
3. **TransAtt-German (Blue)**:
- Slightly lower TPR than Italian and Japanese, with a gradual increase.
- AUC = 0.8266, indicating moderate performance.
4. **TransAtt-French (Orange)**:
- TPR lags behind German, with a slower rise.
- AUC = 0.8104, reflecting lower discriminative power.
5. **TransAtt-Chinese (Red)**:
- Lowest TPR across all FPR values, with a flatter curve.
- AUC = 0.7669, the poorest performance among the languages.
6. **Random Guess (Dashed Gray Line)**:
- Diagonal line from (0,0) to (1,1), representing chance-level performance.
- All language-specific curves lie above this line, confirming superior model performance.
### Key Observations
- **Performance Hierarchy**: Japanese > Italian > German > French > Chinese.
- **AUC Disparity**: Chinese model underperforms significantly compared to others (AUC = 0.7669 vs. Japanese AUC = 0.8590).
- **Convergence**: All curves approach the top-right corner (TPR = 1.0, FPR = 1.0), but Japanese and Italian models achieve this with lower FPR.
### Interpretation
The ROC curves demonstrate that the TransAtt model's effectiveness varies by language, with Japanese and Italian achieving the highest discrimination between classes (AUC > 0.85). The Chinese model lags behind, suggesting potential challenges in handling linguistic nuances or data quality issues for that language. The Random Guess line establishes a baseline, emphasizing that all models outperform chance. These results highlight the importance of language-specific tuning or data augmentation for underperforming languages like Chinese. The proximity of Japanese and Italian curves suggests similar architectural or training efficacy for these languages.