## Heatmap: Performance vs. Number of Feedback Repairs and Initial Programs
### Overview
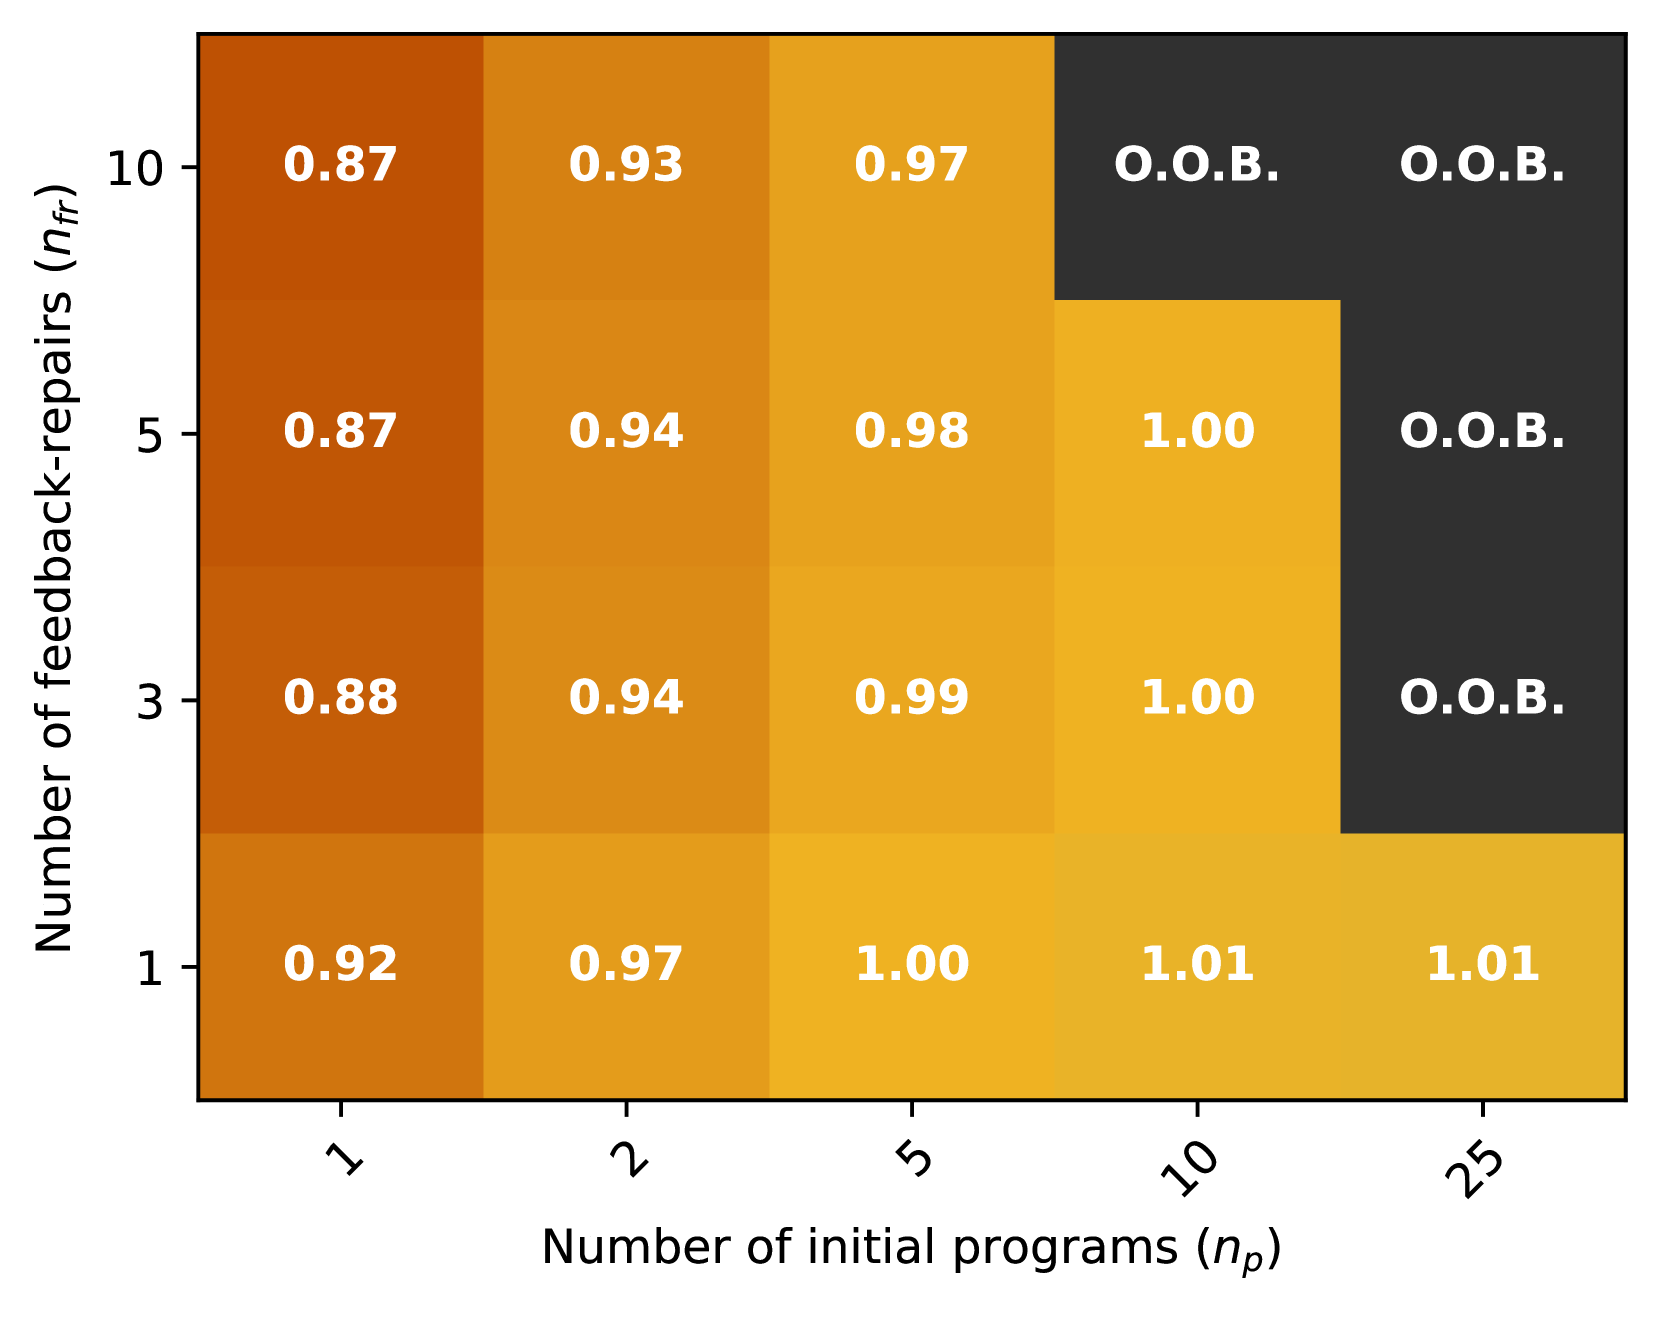
The image is a heatmap displaying performance values for different combinations of "Number of feedback-repairs" (nfr) and "Number of initial programs" (np). The heatmap uses a color gradient, with darker shades of orange representing lower values and lighter shades of yellow representing higher values. Some cells are marked "O.O.B." in dark grey, indicating "Out of Bounds".
### Components/Axes
* **X-axis (Horizontal):** "Number of initial programs (np)" with values 1, 2, 5, 10, and 25.
* **Y-axis (Vertical):** "Number of feedback-repairs (nfr)" with values 1, 3, 5, and 10.
* **Data:** The cells within the heatmap contain numerical values or the label "O.O.B.". The color of each cell corresponds to the value it represents.
### Detailed Analysis
The heatmap presents a matrix of performance values. Here's a breakdown of the data:
| nfr | np = 1 | np = 2 | np = 5 | np = 10 | np = 25 |
|---|---|---|---|---|---|
| 10 | 0.87 | 0.93 | 0.97 | O.O.B. | O.O.B. |
| 5 | 0.87 | 0.94 | 0.98 | 1.00 | O.O.B. |
| 3 | 0.88 | 0.94 | 0.99 | 1.00 | O.O.B. |
| 1 | 0.92 | 0.97 | 1.00 | 1.01 | 1.01 |
* **nfr = 10:** The performance values are 0.87, 0.93, and 0.97 for np = 1, 2, and 5, respectively. The values for np = 10 and np = 25 are "O.O.B.".
* **nfr = 5:** The performance values are 0.87, 0.94, 0.98, and 1.00 for np = 1, 2, 5, and 10, respectively. The value for np = 25 is "O.O.B.".
* **nfr = 3:** The performance values are 0.88, 0.94, 0.99, and 1.00 for np = 1, 2, 5, and 10, respectively. The value for np = 25 is "O.O.B.".
* **nfr = 1:** The performance values are 0.92, 0.97, 1.00, 1.01, and 1.01 for np = 1, 2, 5, 10, and 25, respectively.
### Key Observations
* The performance generally increases as the number of initial programs (np) increases, up to a certain point.
* For lower values of nfr (1, 3, 5), the performance tends to increase as np increases.
* For higher values of nfr (10), the performance values are "O.O.B." for higher values of np (10 and 25).
* The highest performance values (1.00 and 1.01) are observed when nfr = 1.
* The lowest performance values (0.87 and 0.88) are observed when np = 1.
### Interpretation
The heatmap suggests that increasing the number of initial programs (np) generally improves performance, but this effect is limited by the number of feedback repairs (nfr). When the number of feedback repairs is high (nfr = 10), the system may become unstable or encounter issues, resulting in "O.O.B." values for higher numbers of initial programs. The best performance is achieved with a low number of feedback repairs (nfr = 1) and a moderate to high number of initial programs (np = 5, 10, or 25). This indicates that a balance between exploration (initial programs) and refinement (feedback repairs) is crucial for optimal performance. The "O.O.B." values suggest that there are limits to how much the system can benefit from increasing both parameters simultaneously.