\n
## Heatmap: Feedback-Repairs vs. Initial Programs
### Overview
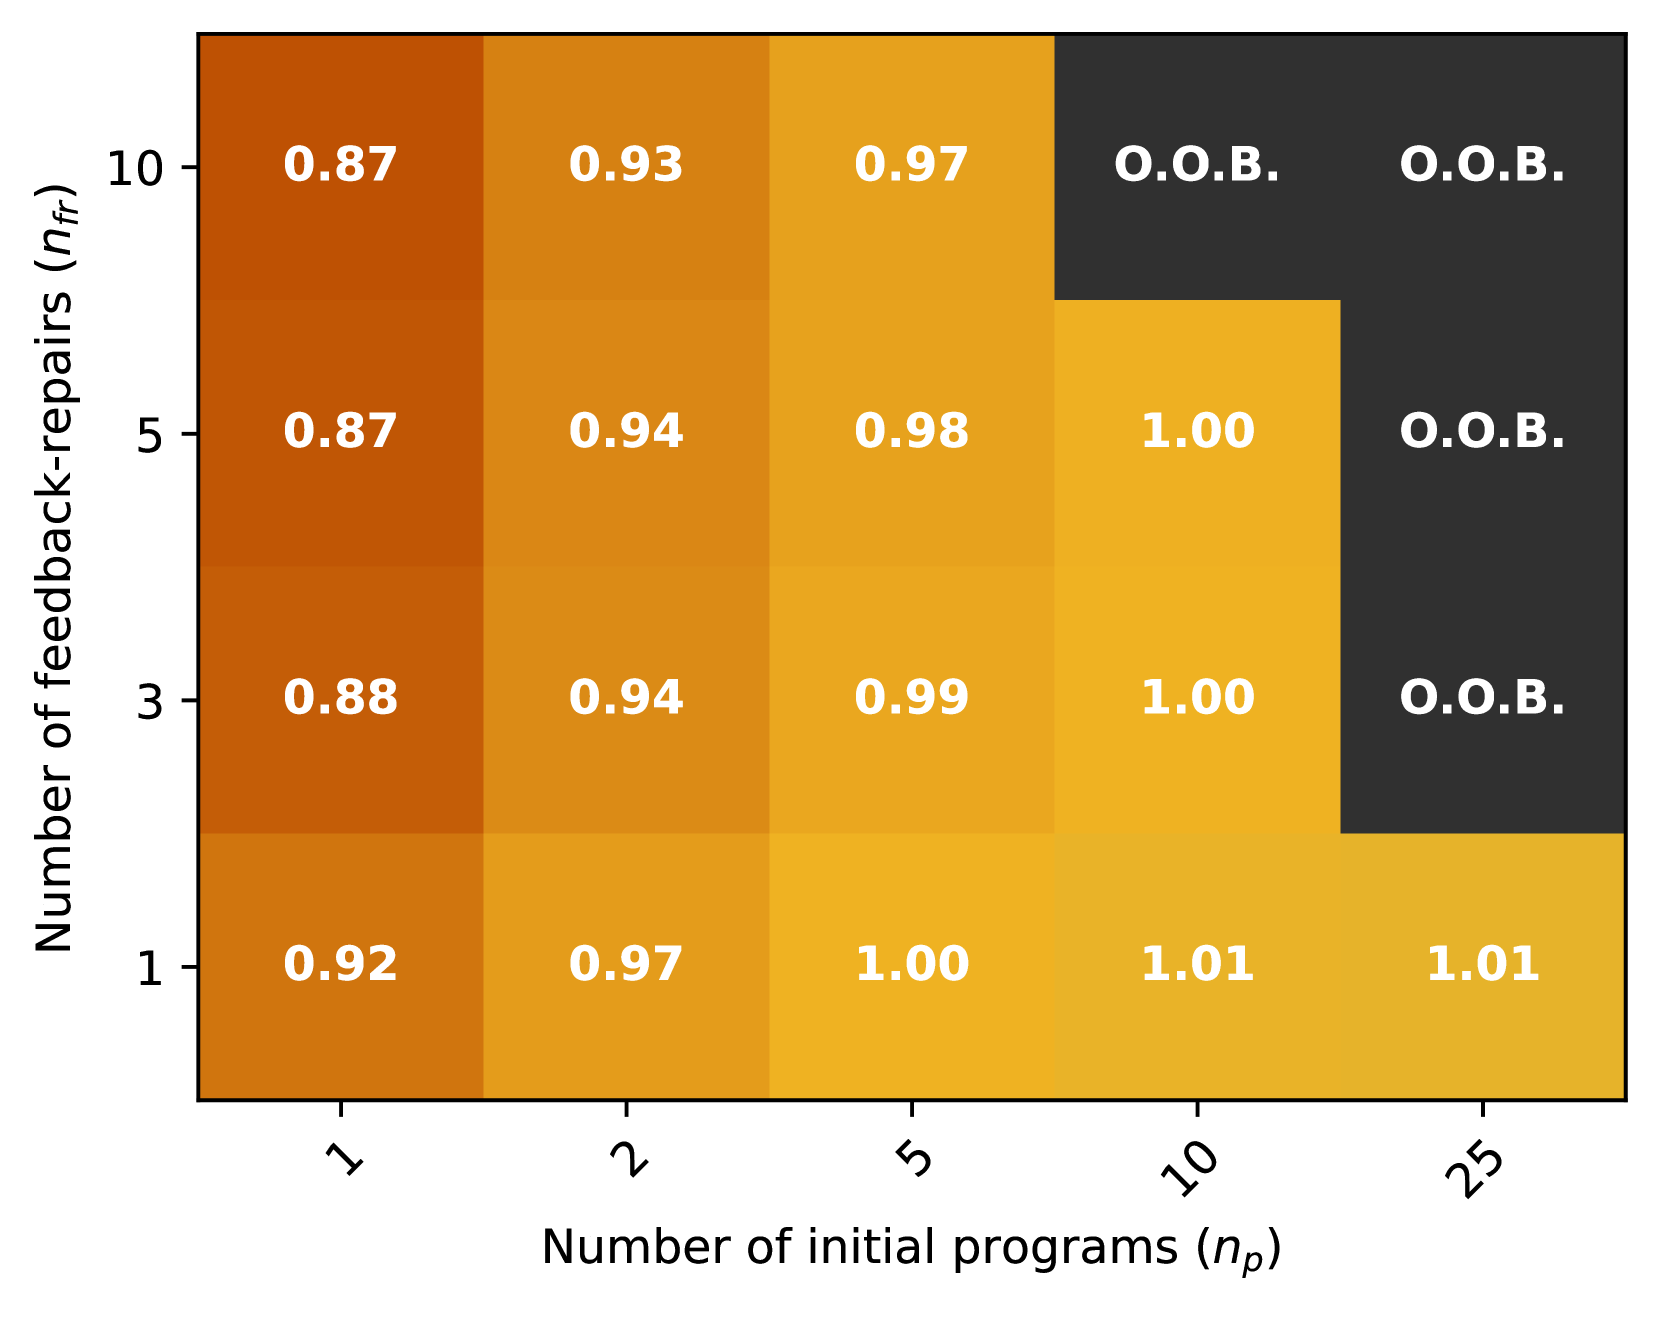
This image presents a heatmap visualizing the relationship between the number of feedback-repairs (n<sub>f</sub>) and the number of initial programs (n<sub>p</sub>). The heatmap uses a color gradient to represent numerical values, ranging from approximately 0.87 to 1.01, with darker shades indicating lower values and lighter shades indicating higher values. Several cells are marked with "O.O.B." which likely stands for "Out Of Bounds".
### Components/Axes
* **X-axis:** Number of initial programs (n<sub>p</sub>) with markers at 1, 2, 5, 10, and 25.
* **Y-axis:** Number of feedback-repairs (n<sub>f</sub>) with markers at 1, 3, 5, and 10.
* **Color Scale:** A gradient from dark orange/red to light yellow, representing values from approximately 0.87 to 1.01.
* **Data Labels:** Numerical values are displayed within each cell of the heatmap.
* **O.O.B. Labels:** Several cells are labeled "O.O.B." indicating values are out of bounds.
### Detailed Analysis
The heatmap is a 4x5 grid. Here's a breakdown of the values within each cell:
* **n<sub>f</sub> = 1:**
* n<sub>p</sub> = 1: 0.92
* n<sub>p</sub> = 2: 0.97
* n<sub>p</sub> = 5: 1.00
* n<sub>p</sub> = 10: 1.01
* n<sub>p</sub> = 25: 1.01
* **n<sub>f</sub> = 3:**
* n<sub>p</sub> = 1: 0.88
* n<sub>p</sub> = 2: 0.94
* n<sub>p</sub> = 5: 0.99
* n<sub>p</sub> = 10: 1.00
* n<sub>p</sub> = 25: O.O.B.
* **n<sub>f</sub> = 5:**
* n<sub>p</sub> = 1: 0.87
* n<sub>p</sub> = 2: 0.94
* n<sub>p</sub> = 5: 0.98
* n<sub>p</sub> = 10: 1.00
* n<sub>p</sub> = 25: O.O.B.
* **n<sub>f</sub> = 10:**
* n<sub>p</sub> = 1: 0.87
* n<sub>p</sub> = 2: 0.93
* n<sub>p</sub> = 5: 0.97
* n<sub>p</sub> = 10: O.O.B.
* n<sub>p</sub> = 25: O.O.B.
The values generally increase as both n<sub>f</sub> and n<sub>p</sub> increase, but this trend plateaus and becomes undefined (O.O.B.) for larger values of n<sub>p</sub>, especially with higher n<sub>f</sub>.
### Key Observations
* The values are clustered between 0.87 and 1.01.
* The "O.O.B." labels suggest that the model or calculation used to generate these values has limitations or becomes invalid for certain combinations of n<sub>f</sub> and n<sub>p</sub>.
* The values appear to stabilize around 1.00-1.01 when n<sub>p</sub> is 10 or 25 and n<sub>f</sub> is 1.
* The lowest values are observed when n<sub>f</sub> is 1 or 3 and n<sub>p</sub> is 1.
### Interpretation
This heatmap likely represents the performance or success rate of a system undergoing feedback and repair. The x-axis represents the initial complexity or diversity of programs, while the y-axis represents the amount of iterative refinement through feedback-repair cycles. The values within the heatmap likely represent a metric of success, such as accuracy, efficiency, or robustness.
The increasing values with increasing n<sub>f</sub> and n<sub>p</sub> suggest that both initial program diversity and iterative refinement contribute to improved performance. However, the "O.O.B." values indicate that there's a limit to how much improvement can be achieved through feedback-repair, particularly when starting with a large number of initial programs. This could be due to diminishing returns, computational constraints, or the inherent limitations of the feedback-repair process itself.
The plateauing of values at higher n<sub>p</sub> and n<sub>f</sub> suggests that the system reaches a point of saturation where further refinement doesn't yield significant gains. The fact that the values are close to 1.00 suggests that the system is generally performing well, but the "O.O.B." values highlight the need to understand the conditions under which the model breaks down or becomes unreliable.