## Heatmap: Relationship Between Initial Programs and Feedback-Repairs
### Overview
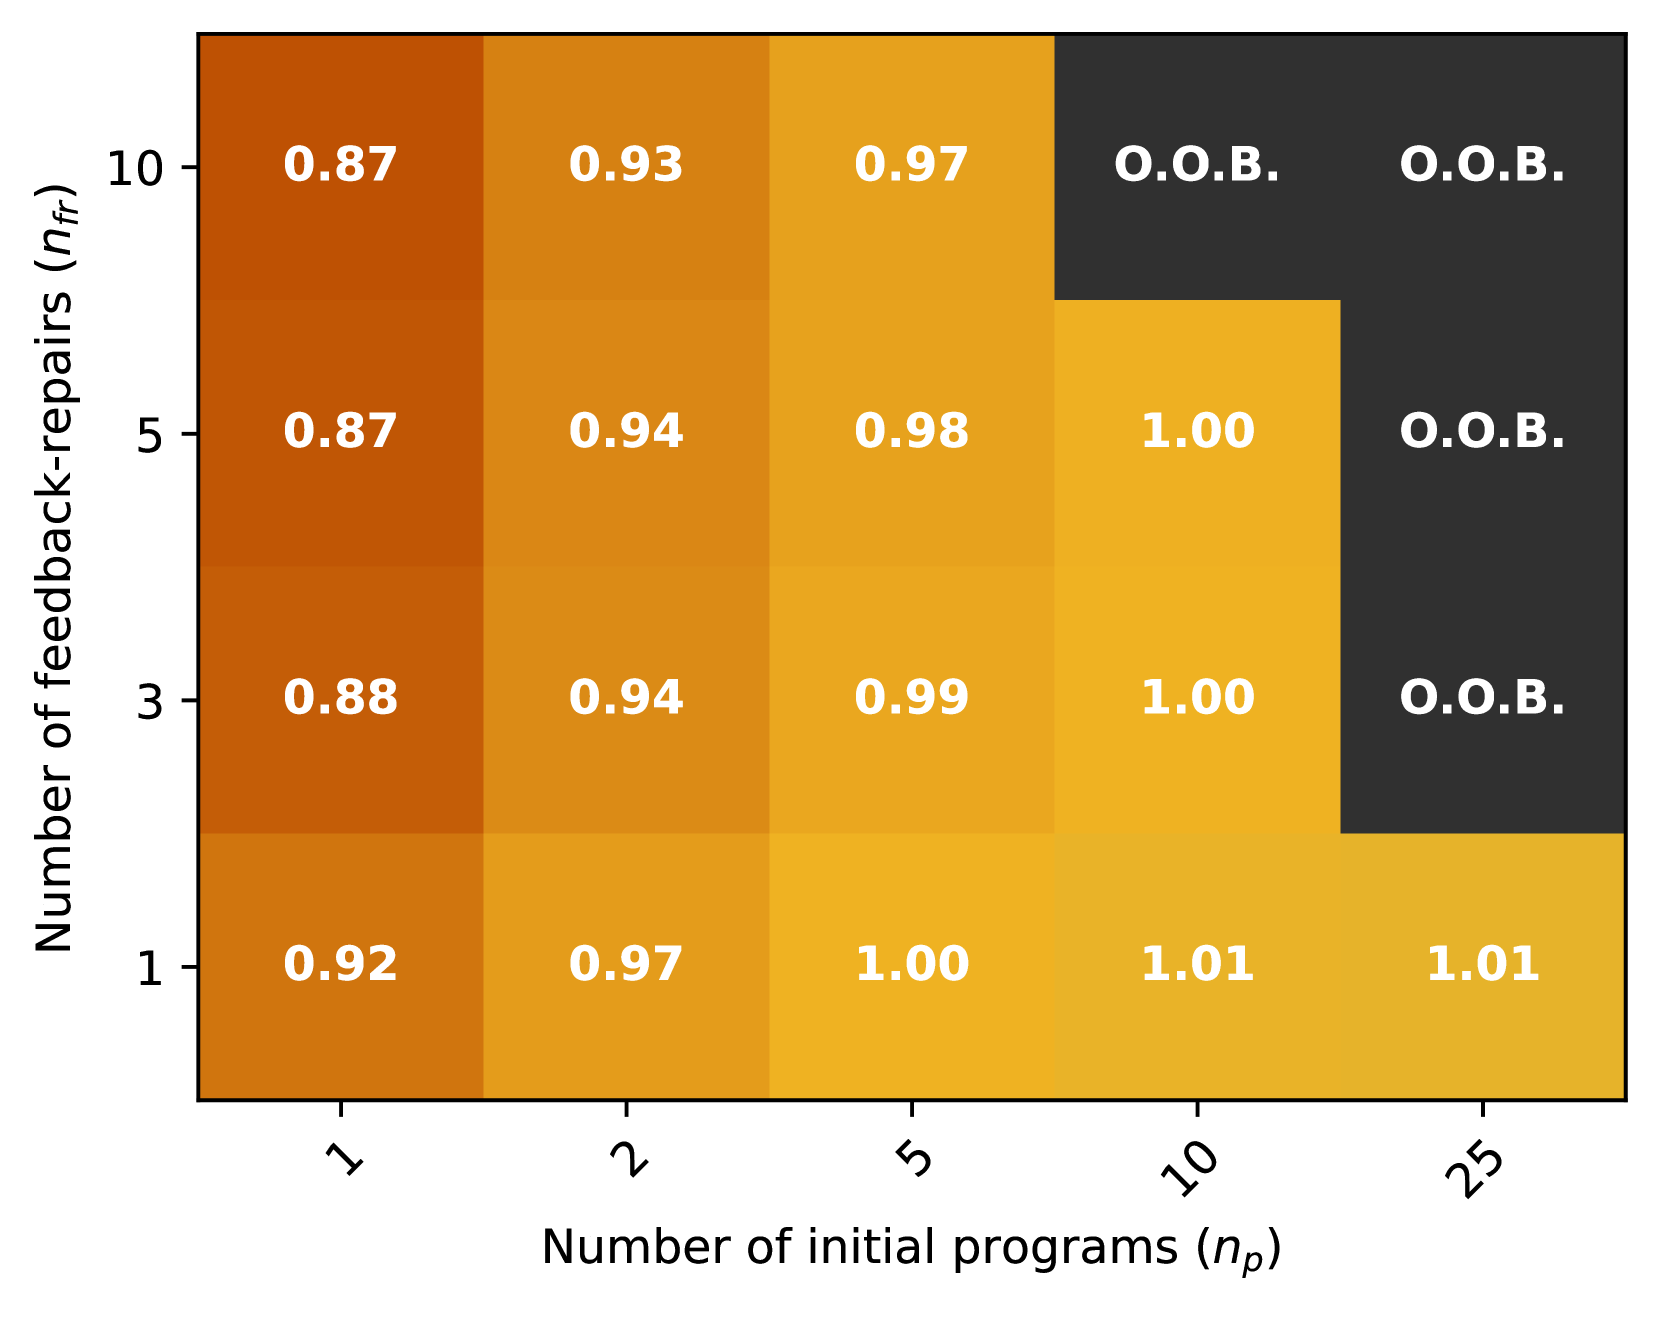
The image is a heatmap chart visualizing a numerical metric (likely a performance score, success rate, or efficiency ratio) as a function of two variables: the "Number of initial programs (n_p)" on the x-axis and the "Number of feedback-repairs (n_fr)" on the y-axis. The data is presented in a 5x4 grid. The color of each cell corresponds to its value, with a gradient from dark orange (lower values) to bright yellow (higher values). A distinct dark gray color is used for cells labeled "O.O.B.".
### Components/Axes
* **X-Axis (Horizontal):**
* **Label:** "Number of initial programs (n_p)"
* **Categories/Markers (from left to right):** 1, 2, 5, 10, 25
* **Y-Axis (Vertical):**
* **Label:** "Number of feedback-repairs (n_fr)"
* **Categories/Markers (from bottom to top):** 1, 3, 5, 10
* **Legend/Color Scale:** There is no separate legend box. The color gradient is implicit:
* **Dark Orange:** Represents lower numerical values (e.g., ~0.87-0.92).
* **Bright Yellow:** Represents higher numerical values (e.g., ~0.97-1.01).
* **Dark Gray:** Represents the categorical label "O.O.B." (likely meaning "Out Of Bounds" or a similar status indicating the condition was not met or data is unavailable).
* **Spatial Layout:** The axes form the left and bottom borders of the chart. The main data grid occupies the central area. The "O.O.B." cells are clustered in the top-right region of the grid.
### Detailed Analysis
The following table reconstructs the data from the heatmap grid. Values are read directly from the text within each cell.
| n_fr (y-axis) \ n_p (x-axis) | **1** | **2** | **5** | **10** | **25** |
| :--- | :--- | :--- | :--- | :--- | :--- |
| **10** | 0.87 | 0.93 | 0.97 | O.O.B. | O.O.B. |
| **5** | 0.87 | 0.94 | 0.98 | 1.00 | O.O.B. |
| **3** | 0.88 | 0.94 | 0.99 | 1.00 | O.O.B. |
| **1** | 0.92 | 0.97 | 1.00 | 1.01 | 1.01 |
**Trend Verification:**
* **Horizontal Trend (Increasing n_p):** For a fixed number of feedback-repairs (n_fr), moving from left to right, the numerical values generally increase. For example, at n_fr=1, the value rises from 0.92 (n_p=1) to 1.01 (n_p=25). This positive trend holds until the "O.O.B." condition is triggered for higher n_fr values.
* **Vertical Trend (Increasing n_fr):** For a fixed number of initial programs (n_p), moving from bottom to top, the numerical values generally decrease slightly. For example, at n_p=1, the value decreases from 0.92 (n_fr=1) to 0.87 (n_fr=10). Furthermore, the likelihood of encountering "O.O.B." increases significantly as n_fr increases.
### Key Observations
1. **Peak Performance:** The highest recorded value is **1.01**, occurring at the combination of **n_p=10, n_fr=1** and **n_p=25, n_fr=1**.
2. **"O.O.B." Boundary:** The "O.O.B." status appears in a clear pattern. It occurs when:
* n_p is high (10 or 25) **and** n_fr is high (5 or 10).
* Specifically, for n_p=10, O.O.B. occurs at n_fr=10.
* For n_p=25, O.O.B. occurs at n_fr=3, 5, and 10.
3. **Stability at Low n_fr:** When the number of feedback-repairs is low (n_fr=1), all combinations of n_p yield a valid numerical score, and performance improves with more initial programs.
4. **Color-Value Correlation:** The color gradient accurately reflects the numerical values. The darkest orange cells correspond to the lowest values (0.87, 0.88), while the brightest yellow cells correspond to the highest values (1.00, 1.01).
### Interpretation
This heatmap likely illustrates the performance or outcome of an iterative program repair or generation system. The metric (values ~0.87 to 1.01) could represent a normalized success rate, quality score, or efficiency ratio.
* **Core Relationship:** The data suggests a **trade-off or interaction effect** between the initial population size (n_p) and the number of repair iterations (n_fr). Increasing the initial number of programs (n_p) generally improves the outcome, but this benefit diminishes or reverses when combined with a high number of feedback-repair cycles.
* **Meaning of "O.O.B.":** The "Out Of Bounds" label for high n_p and high n_fr combinations is critical. It may indicate that the system becomes unstable, resources are exhausted, or the process fails to converge when both parameters are set too high. This defines a practical operational boundary for the system.
* **Optimal Zone:** The "sweet spot" for maximizing the metric appears to be a **moderate-to-high number of initial programs (n_p=5 to 25) combined with a low number of feedback-repairs (n_fr=1)**. This configuration yields the highest scores (1.00-1.01) without triggering the O.O.B. condition.
* **Diminishing Returns:** The slight decrease in score as n_fr increases (for valid cells) suggests that additional repair cycles beyond a certain point may not be beneficial and could even be slightly detrimental to the measured outcome, possibly due to overfitting or increased complexity.
In summary, the chart demonstrates that while more initial programs are beneficial, the system's ability to handle extensive feedback-repair cycles is limited. Optimal performance requires balancing these two parameters, favoring a larger initial pool with minimal iterative repairs.