## Scatter Plot: Relationship Between C and MA
### Overview
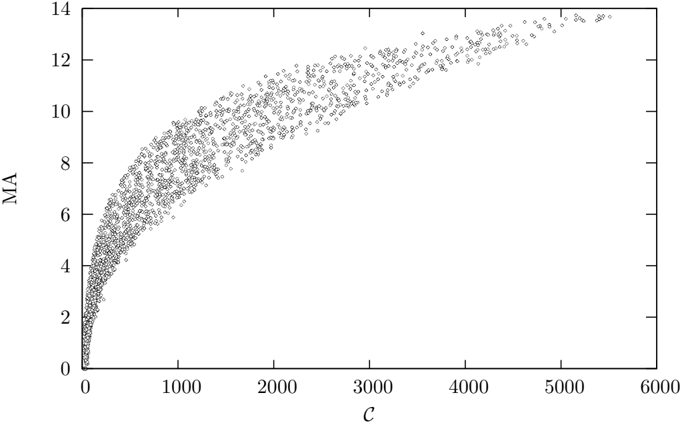
The image is a scatter plot depicting the relationship between two variables, labeled "C" (x-axis) and "MA" (y-axis). The data points form a nonlinear curve that starts steeply and gradually flattens as "C" increases. The plot spans from 0 to 6000 on the x-axis and 0 to 14 on the y-axis.
### Components/Axes
- **X-axis (C)**: Labeled "C", with values ranging from 0 to 6000 in increments of 1000.
- **Y-axis (MA)**: Labeled "MA", with values ranging from 0 to 14 in increments of 2.
- **Data Points**: Scattered dots forming a curve. No legend or additional labels are present.
### Detailed Analysis
- **Initial Trend**: At low values of "C" (0–1000), "MA" increases rapidly, with data points densely packed near the origin.
- **Mid-Range Trend**: Between "C" = 1000 and 3000, the curve continues upward but with a less steep slope.
- **High-Value Trend**: Beyond "C" = 3000, the curve flattens significantly, with "MA" values plateauing near 12–14.
- **Data Distribution**: Points are clustered along the curve, with minimal deviation. No outliers are visible.
### Key Observations
1. **Nonlinear Relationship**: The curve suggests a diminishing return effect, where "MA" increases with "C" but at a decreasing rate.
2. **Saturation Point**: "MA" appears to approach a maximum value (~12–14) as "C" increases beyond 3000.
3. **Data Density**: Points are tightly grouped along the curve, indicating a strong correlation between "C" and "MA".
### Interpretation
The plot demonstrates that "MA" is a function of "C" with a nonlinear relationship. The initial steep rise implies a strong dependency at low "C" values, while the flattening curve suggests diminishing returns or a saturation threshold. This could indicate a system where increasing "C" yields progressively smaller gains in "MA" after a certain point. The absence of a legend or additional context limits the ability to assign specific units or meanings to "C" and "MA", but the trend itself is clear. The data may represent a physical, economic, or computational relationship, but further information is needed for precise interpretation.