# Technical Document Extraction: Line Graph Analysis
## Axes and Scale
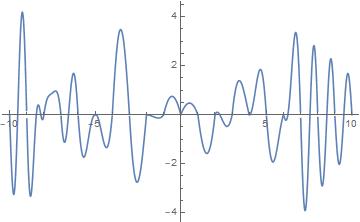
- **X-Axis**:
- Range: -10 to 10
- No explicit labels or units provided
- **Y-Axis**:
- Range: -4 to 4
- No explicit labels or units provided
## Graph Characteristics
- **Line Type**:
- Single continuous blue line
- Oscillatory behavior with periodic peaks and troughs
- **Amplitude Pattern**:
- Amplitude increases progressively over time (left to right)
- Peaks and troughs become more pronounced toward the right side of the graph
- **Frequency**:
- Consistent oscillation frequency observed throughout the graph
## Textual Elements
- **No Labels**:
- No axis titles, legends, or annotations present
- **No Data Table**:
- No embedded tables or categorical data referenced
- **No Legends**:
- No color-key or legend to associate line color (blue) with specific data series
## Observations
1. The graph represents a time-dependent oscillatory system with growing amplitude.
2. The absence of labels suggests the axes may represent normalized or unitless quantities.
3. The increasing amplitude implies energy input or instability in the modeled system.