## Diagram: Schematic Flow and Polarity System
### Overview
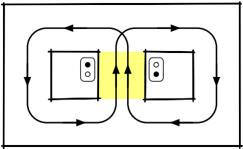
The image is a technical schematic illustrating a bilaterally symmetric system. It features two square regions connected by a central, yellow-highlighted rectangular zone. Two closed-loop flow paths circulate around these squares, converging in the central region. Inside each square is a small rectangular icon containing a pair of dots (one black, one white) arranged in an inverted vertical orientation relative to one another.
### Components/Axes
* **Outer Frame:** A rectangular border enclosing the entire system.
* **Central Region:** A yellow-shaded rectangle connecting the two main squares.
* **Flow Paths:** Two continuous, closed-loop lines with directional arrows.
* **Internal Icons:** Two small rectangles, one positioned inside each of the two main squares.
* **Left Icon:** Contains a black dot (top) and a white dot (bottom).
* **Right Icon:** Contains a white dot (top) and a black dot (bottom).
### Detailed Analysis
* **Flow Dynamics:**
* The system is perfectly symmetric across the vertical axis.
* **Central Region:** Both flow paths pass through the central yellow region moving in the same direction (upward).
* **Left Loop:** This path moves in a counter-clockwise direction. It travels upward through the central yellow region, turns left at the top, descends along the left outer edge, and turns right along the bottom to return to the central region.
* **Right Loop:** This path moves in a clockwise direction. It travels upward through the central yellow region, turns right at the top, descends along the right outer edge, and turns left along the bottom to return to the central region.
* **Internal Iconography:**
* The icons represent a complementary or inverted state between the two squares.
* **Left Square:** The black dot is positioned superior to the white dot.
* **Right Square:** The white dot is positioned superior to the black dot.
### Key Observations
* **Symmetry:** The diagram exhibits perfect mirror symmetry across the vertical axis.
* **Shared Flow:** The central yellow region acts as a shared conduit where the two flow paths are parallel and unidirectional (upward).
* **Inversion:** The internal icons are inverted relative to each other, suggesting a "push-pull" or "positive-negative" relationship between the two squares.
* **Absence of Text:** There are no alphanumeric labels, axis titles, or legends provided in the image.
### Interpretation
This diagram likely represents a physical or theoretical model involving flux, polarity, or convection.
* **Magnetic/Electromagnetic Analogy:** The diagram strongly resembles a magnetic circuit. The two squares could represent magnetic cores or coils, and the arrows represent the direction of magnetic flux. The central yellow region might represent a shared core or a gap where flux is concentrated. The dots likely represent magnetic poles (North/South), where the inversion indicates that the two sides are magnetically opposite or out of phase.
* **Fluid Dynamics:** Alternatively, this could represent two convection cells. The central yellow region might be a heat source or a barrier, forcing fluid upward in both cells simultaneously.
* **Systemic Logic:** The diagram demonstrates a system of balanced, opposing forces that converge in the center. The "upward" flow in the center suggests a central driving force or "fountain" effect, while the outer loops represent the return paths. The inverted dot patterns confirm that the system is designed to maintain a state of complementary equilibrium.