## Histogram: Math-Shepherd Per-step Length Distribution
### Overview
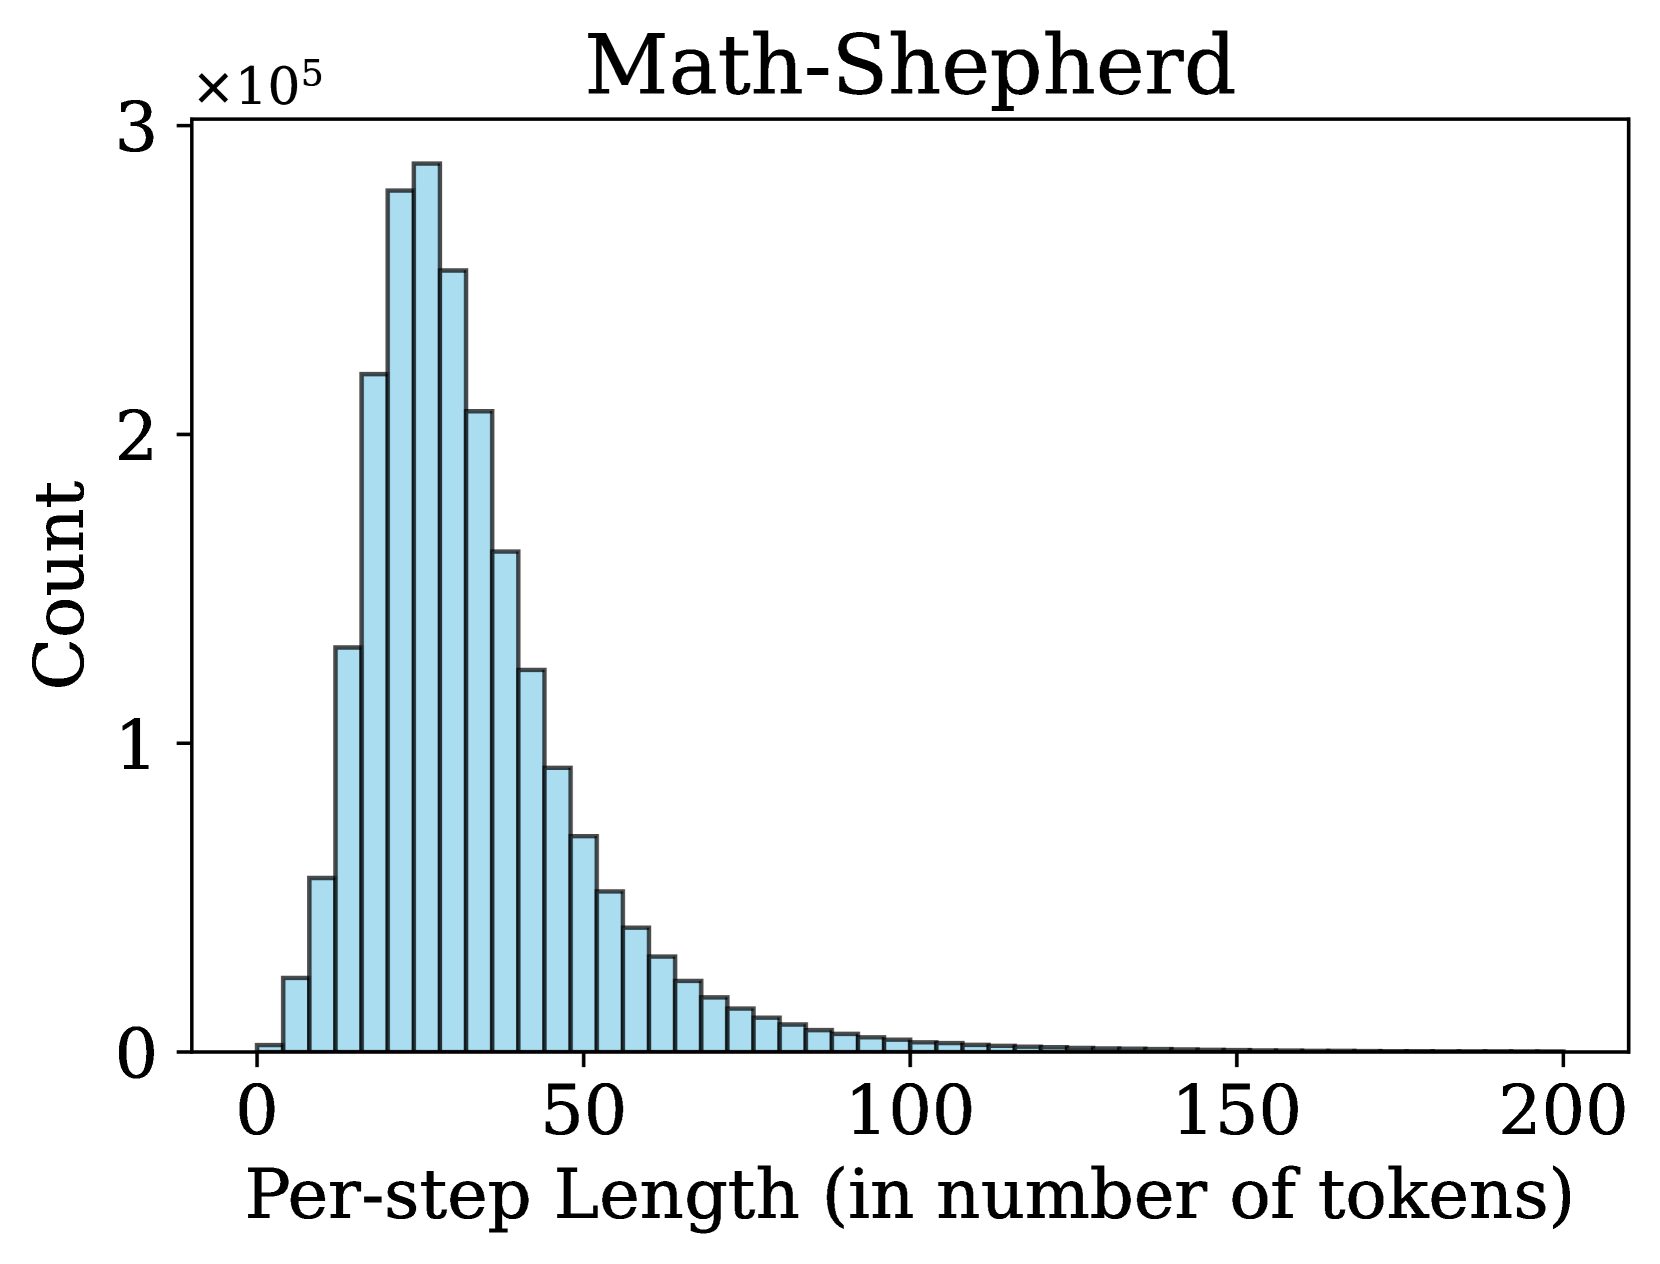
The image is a histogram showing the distribution of "Per-step Length (in number of tokens)" for "Math-Shepherd". The x-axis represents the per-step length, and the y-axis represents the count, scaled by 10^5. The histogram shows a right-skewed distribution, with the highest count occurring at lower per-step lengths.
### Components/Axes
* **Title:** Math-Shepherd
* **X-axis:** Per-step Length (in number of tokens)
* Scale: 0 to 200, with tick marks at 0, 50, 100, 150, and 200.
* **Y-axis:** Count
* Scale: 0 to 3 x 10^5, with tick marks at 0, 1 x 10^5, 2 x 10^5, and 3 x 10^5.
* **Bars:** The histogram bars are light blue with dark gray outlines.
### Detailed Analysis
The histogram bars represent the frequency of each per-step length. The distribution is right-skewed, meaning that there are more instances of shorter per-step lengths than longer ones.
* The highest count occurs around a per-step length of approximately 25 tokens, with a count of approximately 2.8 x 10^5.
* The count decreases as the per-step length increases.
* At a per-step length of 50 tokens, the count is approximately 1.3 x 10^5.
* At a per-step length of 100 tokens, the count is approximately 0.1 x 10^5.
* Beyond 150 tokens, the count is very low, approaching zero.
### Key Observations
* The distribution is heavily skewed towards shorter per-step lengths.
* The peak of the distribution is around 25 tokens.
* Longer per-step lengths are relatively rare.
### Interpretation
The histogram suggests that the "Math-Shepherd" model predominantly uses shorter per-step lengths. The right-skewed distribution indicates that while longer per-step lengths are possible, they are significantly less frequent. This could be due to the nature of the mathematical tasks being performed, or the way the model is designed to process information. The concentration of counts around 25 tokens suggests that this length is optimal or most common for the model's operations.