\n
## Histogram: Math-Shepherd Per-step Length
### Overview
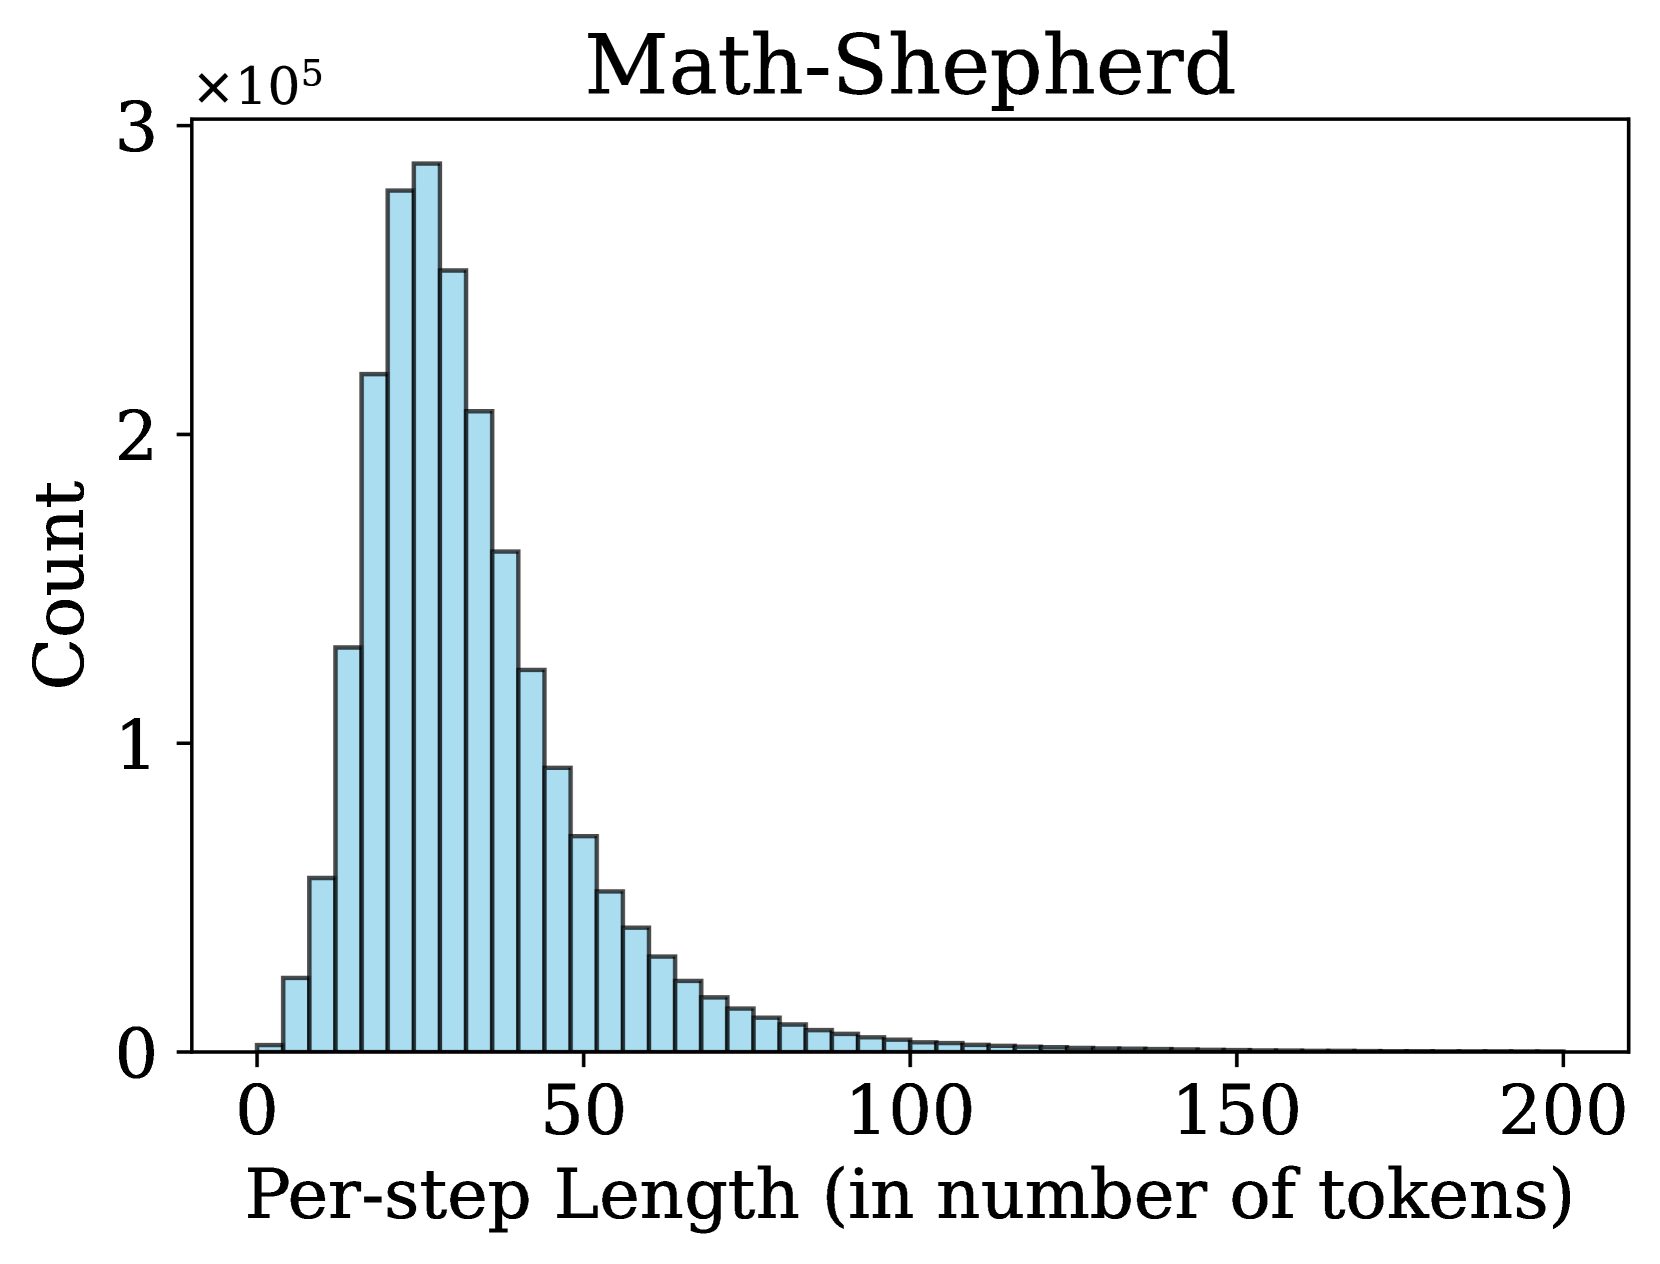
The image presents a histogram visualizing the distribution of "Per-step Length" (measured in number of tokens) for a system or process named "Math-Shepherd". The histogram displays the frequency (Count) of different per-step lengths.
### Components/Axes
* **Title:** "Math-Shepherd" (centered at the top)
* **X-axis Label:** "Per-step Length (in number of tokens)" - ranging from approximately 0 to 200.
* **Y-axis Label:** "Count" - ranging from 0 to 3 x 10<sup>5</sup>.
* **Histogram Bars:** Light blue bars representing the frequency of each per-step length.
### Detailed Analysis
The histogram shows a roughly symmetrical distribution, peaking around a per-step length of approximately 20-30 tokens. The distribution appears to be unimodal.
Here's a breakdown of approximate values, reading from left to right:
* **0-10 tokens:** Count is approximately 1.5 x 10<sup>5</sup>.
* **10-20 tokens:** Count increases to approximately 2.8 x 10<sup>5</sup>.
* **20-30 tokens:** Count reaches a peak of approximately 3.0 x 10<sup>5</sup>.
* **30-40 tokens:** Count decreases to approximately 2.4 x 10<sup>5</sup>.
* **40-50 tokens:** Count decreases to approximately 1.7 x 10<sup>5</sup>.
* **50-60 tokens:** Count decreases to approximately 1.0 x 10<sup>5</sup>.
* **60-70 tokens:** Count decreases to approximately 0.6 x 10<sup>5</sup>.
* **70-80 tokens:** Count decreases to approximately 0.3 x 10<sup>5</sup>.
* **80-90 tokens:** Count decreases to approximately 0.15 x 10<sup>5</sup>.
* **90-100 tokens:** Count decreases to approximately 0.07 x 10<sup>5</sup>.
* **100-150 tokens:** Count continues to decrease, approaching 0.
* **150-200 tokens:** Count is very low, close to 0.
The bars are of equal width, representing equal ranges of per-step length.
### Key Observations
* The most frequent per-step length is between 20 and 30 tokens.
* The distribution is right-skewed, meaning there's a longer tail extending towards higher per-step lengths.
* The count drops off rapidly for per-step lengths greater than 80 tokens.
* The distribution is concentrated in the lower range of per-step lengths.
### Interpretation
This histogram suggests that the "Math-Shepherd" system typically operates with relatively short per-step lengths, most commonly between 20 and 30 tokens. The right skew indicates that while most steps are short, there are occasional steps that are significantly longer. This could be due to the complexity of certain mathematical operations or the need for more detailed reasoning in specific cases. The rapid decline in count for longer per-step lengths suggests that these longer steps are rare.
The data provides insight into the granularity of the Math-Shepherd system's processing. A shorter per-step length might indicate a more fine-grained approach, while a longer per-step length could suggest a more coarse-grained approach. Understanding this distribution is crucial for optimizing the system's performance and resource allocation. The concentration of steps in the lower token range suggests that the system is efficient in most cases, but the presence of longer steps warrants further investigation to identify potential bottlenecks or areas for improvement.