\n
## Charts: Normalized Latency and Normalized Broadcast-to-Root Cycle Counts
### Overview
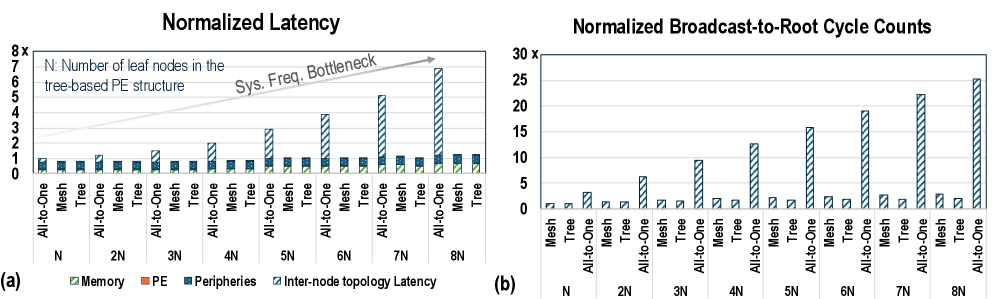
The image presents two bar charts, labeled (a) and (b), comparing performance metrics for different parallel execution (PE) structures: All-to-One, Mesh, and Tree. Chart (a) displays "Normalized Latency," while chart (b) shows "Normalized Broadcast-to-Root Cycle Counts." Both charts vary the number of leaf nodes (N) in the tree-based PE structure from N to 8N. A gray line in chart (a) indicates a "Sys. Freq. Bottleneck."
### Components/Axes
**Chart (a): Normalized Latency**
* **X-axis:** PE Structure and Leaf Node Count. Categories: "All-to-One", "Mesh", "Tree". Leaf Node Count: "N", "2N", "3N", "4N", "5N", "6N", "7N", "8N".
* **Y-axis:** Normalized Latency (Scale: 0 to 8, with increments of 1).
* **Legend:**
* Memory (Blue)
* PE (Orange)
* Peripheries (Gray)
* Inter-node topology Latency (Hatched Gray)
* **Annotation:** "N: Number of leaf nodes in the tree-based PE structure"
* **Trend Line:** "Sys. Freq. Bottleneck" (Gray line, slopes upward)
**Chart (b): Normalized Broadcast-to-Root Cycle Counts**
* **X-axis:** PE Structure and Leaf Node Count. Categories: "All-to-One", "Mesh", "Tree". Leaf Node Count: "N", "2N", "3N", "4N", "5N", "6N", "7N", "8N".
* **Y-axis:** Normalized Broadcast-to-Root Cycle Counts (Scale: 0 to 30, with increments of 5).
* **Legend:** (Same color scheme as Chart a)
* Memory (Blue)
* PE (Orange)
* Peripheries (Gray)
* Inter-node topology Latency (Hatched Gray)
### Detailed Analysis or Content Details
**Chart (a): Normalized Latency**
* **Memory (Blue):** Remains consistently low, around 1.0-1.5 across all PE structures and leaf node counts.
* **PE (Orange):** Also remains relatively low, generally between 1.0 and 2.0, with slight increases for Tree structures at higher leaf node counts.
* **Peripheries (Gray):** Shows a slight increase with increasing leaf node counts for all structures, but remains below 2.0.
* **Inter-node topology Latency (Hatched Gray):** Starts low for N, increases significantly for Tree structures as the leaf node count increases. At 8N, the latency reaches approximately 3.0 for Tree.
* **Trend Line (Sys. Freq. Bottleneck):** Starts at approximately 1.0 and increases linearly to approximately 8.0 at 8N.
**Chart (b): Normalized Broadcast-to-Root Cycle Counts**
* **Memory (Blue):** Remains consistently low, generally below 2.0 across all structures and leaf node counts.
* **PE (Orange):** Similar to Memory, remains low, generally below 2.0.
* **Peripheries (Gray):** Shows a significant increase for Tree structures as the leaf node count increases. At 8N, the cycle count reaches approximately 24.
* **Inter-node topology Latency (Hatched Gray):** Low for Mesh and All-to-One, but increases dramatically for Tree structures with increasing leaf node counts. At 8N, the cycle count reaches approximately 10 for Tree.
### Key Observations
* **Tree structures exhibit increasing latency and cycle counts with increasing leaf nodes.** This is particularly pronounced for Inter-node topology Latency and Peripheries in both charts.
* **Mesh and All-to-One structures maintain relatively stable performance** across varying leaf node counts.
* **Memory and PE components consistently show low latency and cycle counts** compared to Peripheries and Inter-node topology Latency.
* **The "Sys. Freq. Bottleneck" trend line in Chart (a) suggests a system frequency limitation** that becomes more significant as the number of leaf nodes increases.
### Interpretation
The data suggests that scaling tree-based PE structures by increasing the number of leaf nodes introduces significant performance bottlenecks, particularly related to inter-node communication and peripheries. The increasing latency and cycle counts for Tree structures indicate that the communication overhead grows rapidly with the number of nodes. The "Sys. Freq. Bottleneck" line implies that the system's clock frequency may be limiting the performance of these structures as they scale.
Mesh and All-to-One structures appear to be more scalable, as their performance remains relatively stable with increasing leaf nodes. This suggests that these structures have lower communication overhead or are less sensitive to the system's frequency limitations.
The consistently low performance of Memory and PE components indicates that these are not the primary bottlenecks in the system. The focus for optimization should be on reducing the latency and cycle counts associated with inter-node communication and peripheries, especially in tree-based PE structures. The data highlights a trade-off between scalability and performance in parallel execution structures, with tree structures becoming less efficient as the number of nodes increases.