## Bar Charts: Normalized Latency and Broadcast-to-Root Cycle Counts
### Overview
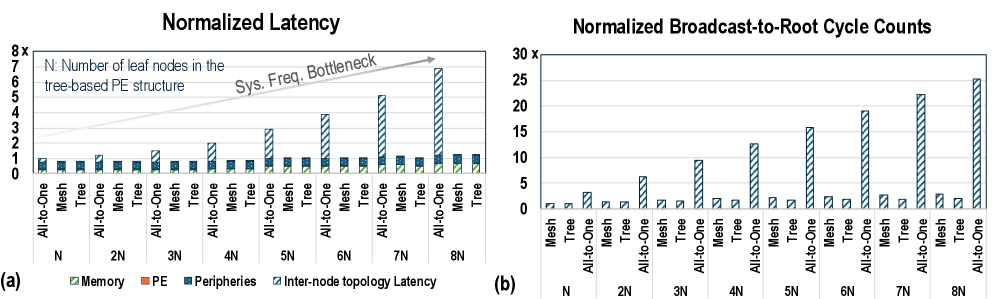
The image contains two bar charts comparing performance metrics across different network topologies (All-to-One, Mesh, Tree) and scaling factors (N, 2N, ..., 8N). The left chart (a) shows **Normalized Latency**, while the right chart (b) shows **Normalized Broadcast-to-Root Cycle Counts**. Both charts use a shared legend for color-coded components: Memory (green), PE (orange), Peripheries (blue), and Inter-node topology Latency (striped blue).
---
### Components/Axes
#### Chart (a): Normalized Latency
- **X-axis**: Categories:
- All-to-One (N, 2N, ..., 8N)
- Mesh (N, 2N, ..., 8N)
- Tree (N, 2N, ..., 8N)
- **Y-axis**: "Normalized Latency" (0 to 8x, linear scale).
- **Legend**:
- Memory (green)
- PE (orange)
- Peripheries (blue)
- Inter-node topology Latency (striped blue)
- **Text annotation**: "Sys. Freq. Bottleneck" with an arrow pointing to the highest bar in the Tree structure (8N).
#### Chart (b): Normalized Broadcast-to-Root Cycle Counts
- **X-axis**: Same categories as Chart (a).
- **Y-axis**: "Normalized Broadcast-to-Root Cycle Counts" (0 to 30x, linear scale).
- **Legend**: Same as Chart (a).
---
### Detailed Analysis
#### Chart (a): Normalized Latency
- **Trend**:
- Inter-node topology Latency (striped blue) dominates and increases sharply with the number of leaf nodes (N → 8N), especially in the Tree structure.
- Memory (green) and Peripheries (blue) remain relatively flat across all topologies and scaling factors.
- PE (orange) shows minor fluctuations but stays below 1x.
- **Key values**:
- Tree structure at 8N: ~7x latency (highest).
- Mesh structure at 8N: ~1.5x latency (lowest).
#### Chart (b): Normalized Broadcast-to-Root Cycle Counts
- **Trend**:
- Tree structure (blue bars) exhibits exponentially higher cycle counts compared to Mesh and All-to-One.
- Mesh structure (green bars) remains consistently low (<5x) across all scaling factors.
- All-to-One (orange bars) shows moderate increases but stays below 10x.
- **Key values**:
- Tree structure at 8N: ~25x cycle counts (highest).
- Mesh structure at 8N: ~2x cycle counts (lowest).
---
### Key Observations
1. **Tree Structure Bottleneck**:
- Both latency and cycle counts for the Tree structure grow disproportionately with the number of leaf nodes, aligning with the "Sys. Freq. Bottleneck" annotation.
2. **Mesh Efficiency**:
- Mesh topology maintains low latency and cycle counts, suggesting better scalability.
3. **Inter-node Latency Dominance**:
- Inter-node topology Latency (striped blue) is the primary contributor to performance degradation in the Tree structure.
---
### Interpretation
The data highlights a critical performance trade-off in tree-based PE structures:
- **Scalability Issues**: As the number of leaf nodes increases (N → 8N), the Tree structure’s inter-node communication overhead becomes a bottleneck, leading to exponential increases in latency and cycle counts.
- **Mesh Advantage**: The Mesh topology’s decentralized communication pattern avoids this bottleneck, maintaining near-constant performance regardless of scaling.
- **Implications**: For large-scale systems, Mesh or hybrid architectures may be preferable to Tree structures to mitigate communication overhead. The "Sys. Freq. Bottleneck" annotation suggests that frequency limitations in inter-node links exacerbate these issues.
---
*Note: All values are approximate, derived from bar heights relative to axis scales.*