## Confusion Matrix: LLM Prediction vs Ground Truth
### Overview
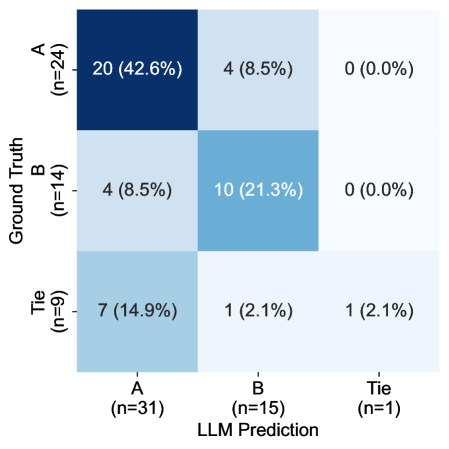
The image displays a 3x3 confusion matrix comparing LLM predictions against ground truth labels. Rows represent ground truth categories (A, B, Tie), and columns represent LLM predictions (A, B, Tie). Each cell contains absolute counts and their percentage contribution to the total dataset (n=47).
### Components/Axes
- **Y-Axis (Ground Truth)**: Categories A (n=24), B (n=14), Tie (n=9)
- **X-Axis (LLM Prediction)**: Categories A (n=31), B (n=15), Tie (n=1)
- **Cells**: Absolute counts and percentages (relative to total n=47)
- **Color Gradient**: Darker blue indicates higher counts/percentages
### Detailed Analysis
| Ground Truth \ Prediction | A (31) | B (15) | Tie (1) |
|---------------------------|--------------|--------------|--------------|
| **A (24)** | 20 (42.6%) | 4 (8.5%) | 0 (0.0%) |
| **B (14)** | 4 (8.5%) | 10 (21.3%) | 0 (0.0%) |
| **Tie (9)** | 7 (14.9%) | 1 (2.1%) | 1 (2.1%) |
**Key Data Points**:
- **Correct Predictions**:
- A: 20/24 (83.3% of ground truth A)
- B: 10/14 (71.4% of ground truth B)
- Tie: 1/9 (11.1% of ground truth Tie)
- **Misclassifications**:
- A→B: 4/24 (16.7% of ground truth A)
- B→A: 4/14 (28.6% of ground truth B)
- Tie→A: 7/9 (77.8% of ground truth Tie)
- Tie→B: 1/9 (11.1% of ground truth Tie)
### Key Observations
1. **Dominant Correct Predictions**:
- A and B categories show strong diagonal dominance (67.2% of total correct predictions)
- Tie category has minimal correct predictions (only 11.1% accuracy)
2. **Cross-Category Confusion**:
- Symmetric misclassification between A and B (4 instances each way)
- Tie predictions overwhelmingly mapped to A (7 instances)
3. **Data Imbalance**:
- A category dominates predictions (63.8% of all predictions)
- Tie category underrepresented in predictions (2.1%)
### Interpretation
The matrix reveals a model with moderate accuracy (55.3% overall: (20+10+1)/47) but significant class imbalance issues. While A and B predictions show reasonable accuracy (83.3% and 71.4% respectively), the Tie category suffers from severe underrepresentation in both ground truth and predictions. The symmetric A↔B confusion suggests potential semantic similarity challenges in the model's understanding. The overwhelming majority of Tie predictions being mapped to A (77.8%) indicates possible bias toward the more frequent A category. This pattern suggests the need for:
1. Balanced training data augmentation for Tie cases
2. Improved semantic differentiation between A and B
3. Threshold adjustment for low-frequency categories