\n
## Multi-Panel Line Chart: Ising Model Energy vs. Time (τ) on Various Network Topologies
### Overview
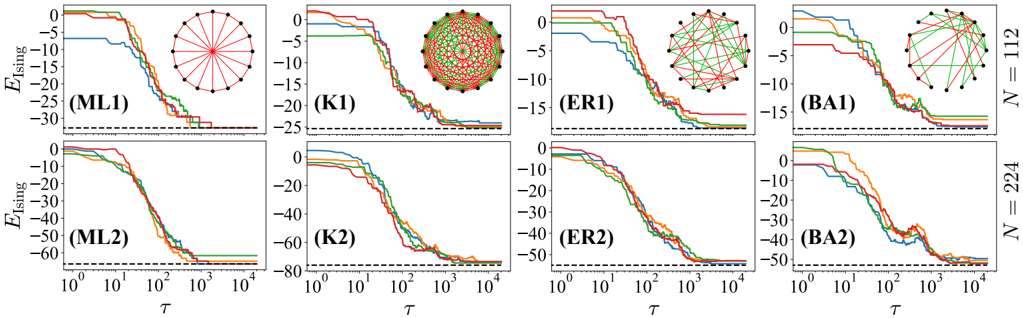
The image displays a 2x4 grid of eight line charts. Each chart plots the Ising model energy (\(E_{\text{Ising}}\)) on the y-axis against a time or temperature parameter (\(\tau\)) on a logarithmic x-axis. Each subplot corresponds to a specific network topology and size, indicated by a label (e.g., ML1, K1) and an inset network diagram. The charts compare the energy minimization dynamics across different network structures and sizes (N=112 and N=224).
### Components/Axes
* **Y-axis (All plots):** Label is \(E_{\text{Ising}}\). The scale is linear but varies in range between subplots (e.g., 0 to -30, 0 to -80).
* **X-axis (All plots):** Label is \(\tau\). The scale is logarithmic, with major tick marks at \(10^0\), \(10^1\), \(10^2\), \(10^3\), and \(10^4\).
* **Subplot Labels:** Each of the eight panels has a unique identifier in parentheses:
* Top Row (Left to Right): **(ML1)**, **(K1)**, **(ER1)**, **(BA1)**
* Bottom Row (Left to Right): **(ML2)**, **(K2)**, **(ER2)**, **(BA2)**
* **Network Size Labels:** Positioned vertically on the far right edge of the figure:
* Top row: **N = 112**
* Bottom row: **N = 224**
* **Inset Network Diagrams:** Each subplot contains a small circular network diagram in its top-right corner. These diagrams visualize the underlying graph structure:
* **ML1/ML2:** Star-like or hub-and-spoke topology (many nodes connected to a central hub).
* **K1/K2:** Highly regular, lattice-like or ring structure with dense local connections.
* **ER1/ER2:** Erdős–Rényi random graph with seemingly random connections.
* **BA1/BA2:** Barabási–Albert scale-free network with a few highly connected hubs.
* **Data Series:** Each plot contains four colored lines. The colors are consistent across plots: **blue, orange, green, and red**. There is no explicit legend within the image; the colors likely represent different simulation runs, initial conditions, or algorithmic variants.
* **Reference Line:** A black dashed horizontal line is present in each subplot, indicating a baseline or minimum energy value.
### Detailed Analysis
**Trend Verification & Data Points (Approximate):**
For each subplot, the general trend is a sigmoidal decrease in \(E_{\text{Ising}}\) as \(\tau\) increases, starting near 0 and plateauing at a lower energy value. The convergence point and rate vary.
* **Top Row (N=112):**
* **(ML1):** All four lines descend steeply between \(\tau = 10^1\) and \(10^2\), converging to approximately **-30** by \(\tau = 10^3\). The dashed line is at ~-30.
* **(K1):** Lines descend between \(\tau = 10^1\) and \(10^3\), converging to approximately **-25**. The dashed line is at ~-25.
* **(ER1):** Lines descend between \(\tau = 10^1\) and \(10^3\), converging to approximately **-15**. The dashed line is at ~-15.
* **(BA1):** Lines descend between \(\tau = 10^1\) and \(10^3\), converging to approximately **-15**. The dashed line is at ~-15.
* **Bottom Row (N=224):**
* **(ML2):** Lines descend steeply between \(\tau = 10^1\) and \(10^2\), converging to approximately **-60** by \(\tau = 10^3\). The dashed line is at ~-60.
* **(K2):** Lines descend between \(\tau = 10^1\) and \(10^3\), converging to approximately **-80**. The dashed line is at ~-80.
* **(ER2):** Lines descend between \(\tau = 10^1\) and \(10^3\), converging to approximately **-50**. The dashed line is at ~-50.
* **(BA2):** Lines descend between \(\tau = 10^1\) and \(10^3\), converging to approximately **-50**. The dashed line is at ~-50.
**Spatial Grounding & Component Isolation:**
* The inset network diagrams are consistently placed in the **top-right corner** of each subplot.
* The subplot labels (e.g., (ML1)) are placed in the **center-left** area of each plot.
* The network size labels (N=112, N=224) are placed **outside the plot area, to the right** of their respective rows.
### Key Observations
1. **Network Size Effect:** Doubling the network size (N=112 to N=224) roughly doubles the magnitude of the final converged energy (e.g., ML1 ~-30 vs. ML2 ~-60; K1 ~-25 vs. K2 ~-80). This suggests the energy scales with system size.
2. **Topology-Dependent Convergence:** The final energy plateau and the convergence speed differ by network type.
* **ML (Star) and K (Lattice)** networks achieve the lowest (most negative) energies for their respective sizes.
* **ER (Random) and BA (Scale-free)** networks converge to higher (less negative) energies compared to ML and K networks of the same size.
3. **Convergence Dynamics:** The descent is generally smooth, but some lines (e.g., in BA1, BA2) show minor fluctuations or "bumps" during the descent phase, particularly around \(\tau = 10^2\) to \(10^3\).
4. **Baseline Alignment:** The final plateau of the data lines aligns closely with the black dashed reference line in all plots, indicating the simulations reach the expected minimum or ground state energy.
### Interpretation
This figure demonstrates the process of energy minimization in the Ising model—a fundamental model in statistical physics—simulated on different complex network topologies. The parameter \(\tau\) likely represents simulation time or an effective temperature being lowered (annealing).
The key finding is that **network structure significantly influences both the final energy state and the path to get there**. Regular, highly structured networks (ML, K) allow the system to find lower-energy configurations more efficiently than random (ER) or heterogeneous (BA) networks. The scaling with system size (N) is also clearly visible.
The different colored lines within each plot, while not labeled, show the variability or robustness of the minimization process across different trials. Their close grouping suggests the outcome is largely deterministic for a given network type and size. The minor fluctuations in the BA networks might reflect the system navigating a more complex energy landscape due to the presence of hubs and a broad degree distribution.
**Language Declaration:** All text in the image is in English. Mathematical symbols (\(E_{\text{Ising}}\), \(\tau\), N) are used.