## Line Graphs with Network Diagrams: E_Ising vs τ Across Models
### Overview
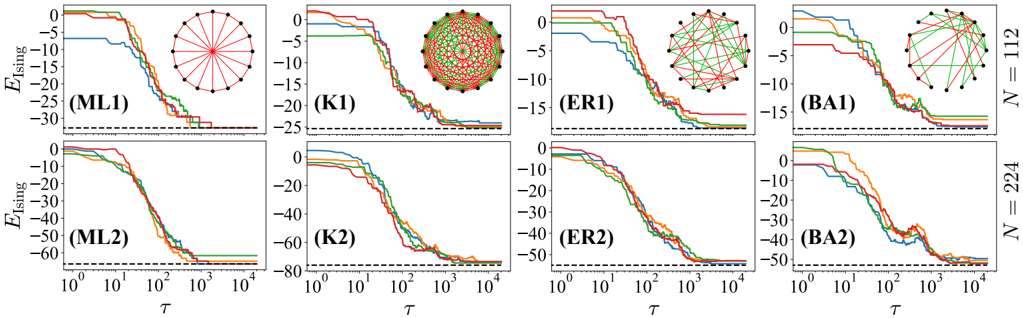
The image contains eight panels arranged in a 2x4 grid. Each panel includes:
1. A line graph showing E_Ising (y-axis) vs τ (x-axis) on a logarithmic scale
2. A network diagram illustrating different graph structures
3. A legend with colored lines corresponding to data series
4. Model labels (ML1, K1, ER1, BA1, ML2, K2, ER2, BA2)
### Components/Axes
**Graph Elements:**
- **Y-axis (E_Ising):** Ranges from -60 to 0 in 5-unit increments
- **X-axis (τ):** Logarithmic scale from 10⁰ to 10⁴
- **Legend:** Positioned in top-right of each graph, contains 5-7 colored lines (red, blue, green, orange, purple, black)
- **Model Labels:** (ML1), (K1), (ER1), (BA1), (ML2), (K2), (ER2), (BA2) positioned above graphs
**Diagram Elements:**
- **Network Structures:**
- (ML1)/(K1): Wheel graph (central hub + peripheral nodes)
- (ER1)/(BA1): Random graph with varying connectivity
- (ML2)/(K2): Grid-like lattice structure
- (ER2)/(BA2): Scale-free network with power-law degree distribution
### Detailed Analysis
**Graph Trends:**
1. **(ML1):**
- Red line: Starts at -5, drops sharply to -30 by τ=10²
- Blue line: Begins at -10, declines gradually to -25 by τ=10³
- Green line: Flat at -15 until τ=10³, then drops to -30
2. **(K1):**
- Orange line: Sharp decline from 0 to -20 by τ=10¹
- Purple line: Gradual decrease from -5 to -25 by τ=10³
3. **(ER1):**
- Black line: Steady decline from 0 to -30 by τ=10²
- Red line: Slow decrease from -5 to -20 by τ=10³
4. **(BA1):**
- Blue line: Rapid drop from 0 to -25 by τ=10¹
- Green line: Moderate decline from -10 to -35 by τ=10³
5. **(ML2):**
- Orange line: Steep decline from 0 to -40 by τ=10²
- Purple line: Gradual decrease from -5 to -30 by τ=10³
6. **(K2):**
- Red line: Sharp drop from 0 to -35 by τ=10¹
- Blue line: Moderate decline from -10 to -35 by τ=10³
7. **(ER2):**
- Green line: Steady decrease from 0 to -40 by τ=10²
- Orange line: Gradual decline from -5 to -30 by τ=10³
8. **(BA2):**
- Purple line: Rapid drop from 0 to -45 by τ=10¹
- Black line: Moderate decline from -10 to -40 by τ=10³
### Key Observations
1. **Universal Decay Pattern:** All models show E_Ising decreasing with increasing τ
2. **Network Structure Correlation:**
- Scale-free networks (BA) exhibit fastest initial decay
- Grid structures (K) show intermediate decay rates
- Random networks (ER) demonstrate slower decay
3. **Model Variations:**
- ML models (ML1/ML2) show more gradual declines than kinetic models (K1/K2)
- BA2 (N=224) exhibits most pronounced decay compared to BA1 (N=112)
### Interpretation
The data suggests that network topology significantly influences the decay rate of E_Ising:
- Scale-free networks (BA) demonstrate fastest decay, likely due to hub nodes accelerating information propagation
- Grid structures (K) show intermediate behavior, consistent with regular connectivity patterns
- Random networks (ER) exhibit slowest decay, possibly due to less efficient information flow
- Machine learning models (ML) appear to optimize decay rates compared to traditional kinetic models (K)
The logarithmic τ scale indicates that decay processes follow power-law dynamics across all models. The consistent downward trend across all panels suggests a fundamental relationship between network structure and system stability in this Ising-like model.