\n
## Line Chart: Surprisal vs. Training Steps
### Overview
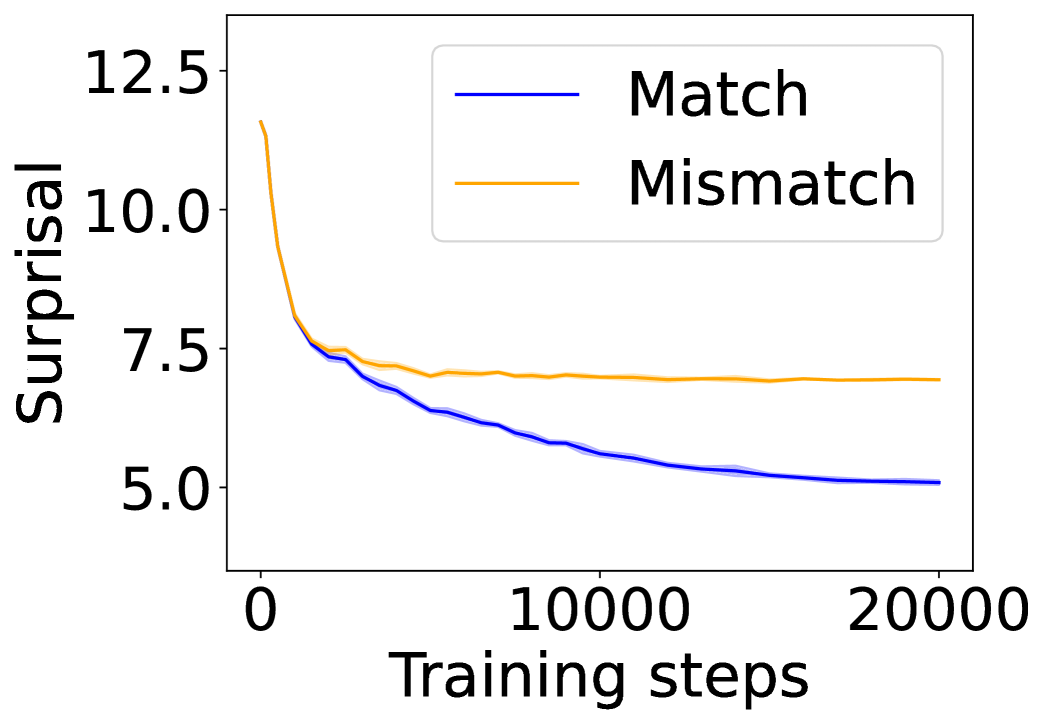
The image presents a line chart illustrating the relationship between "Surprisal" (y-axis) and "Training steps" (x-axis). Two data series are plotted: one representing "Match" and the other "Mismatch". The chart appears to track the surprisal of a model during training, potentially indicating how well the model is learning to predict or represent the data.
### Components/Axes
* **X-axis:** "Training steps", ranging from approximately 0 to 20000. The axis is linearly scaled.
* **Y-axis:** "Surprisal", ranging from approximately 5.0 to 12.5. The axis is linearly scaled.
* **Legend:** Located in the top-right corner of the chart.
* "Match" - represented by a dark blue line.
* "Mismatch" - represented by a light orange line.
### Detailed Analysis
* **Match (Dark Blue Line):** The line starts at approximately 7.3 at 0 training steps and exhibits a generally downward trend, indicating decreasing surprisal as training progresses.
* At approximately 5000 training steps, the surprisal is around 6.5.
* At approximately 10000 training steps, the surprisal is around 5.8.
* At approximately 15000 training steps, the surprisal is around 5.4.
* At approximately 20000 training steps, the surprisal is around 5.1.
* **Mismatch (Light Orange Line):** The line begins at approximately 7.5 at 0 training steps and also shows a decreasing trend, but it plateaus at a higher surprisal level than the "Match" line.
* At approximately 5000 training steps, the surprisal is around 6.8.
* At approximately 10000 training steps, the surprisal is around 6.5.
* At approximately 15000 training steps, the surprisal is around 6.4.
* At approximately 20000 training steps, the surprisal is around 6.3.
### Key Observations
* Both "Match" and "Mismatch" lines demonstrate a decreasing surprisal with increasing training steps, suggesting that the model is learning over time.
* The "Match" line consistently exhibits lower surprisal values than the "Mismatch" line throughout the entire training process. This indicates that the model is better at predicting or representing the "Match" data compared to the "Mismatch" data.
* The rate of decrease in surprisal appears to slow down for both lines as training progresses, suggesting diminishing returns from further training.
* The "Mismatch" line appears to converge towards a stable surprisal value around 6.3, while the "Match" line continues to decrease, albeit at a slower rate.
### Interpretation
The chart suggests that the model is learning to better represent the "Match" data than the "Mismatch" data. The decreasing surprisal for both lines indicates that the model is improving its predictive capabilities with more training. The difference in surprisal between the two lines could be due to several factors, such as:
* The "Match" data being inherently easier to model.
* The "Mismatch" data containing more noise or complexity.
* The model being specifically designed to perform well on the "Match" data.
The plateauing of the "Mismatch" line suggests that the model may have reached its limit in representing this type of data, or that further training would require a different approach. The continued decrease in surprisal for the "Match" line indicates that further training could still yield improvements in performance. This data could be used to evaluate the effectiveness of a training process, or to identify areas where the model could be improved.