## Box Plot: Error (1-AUC) under Different Scenarios
### Overview
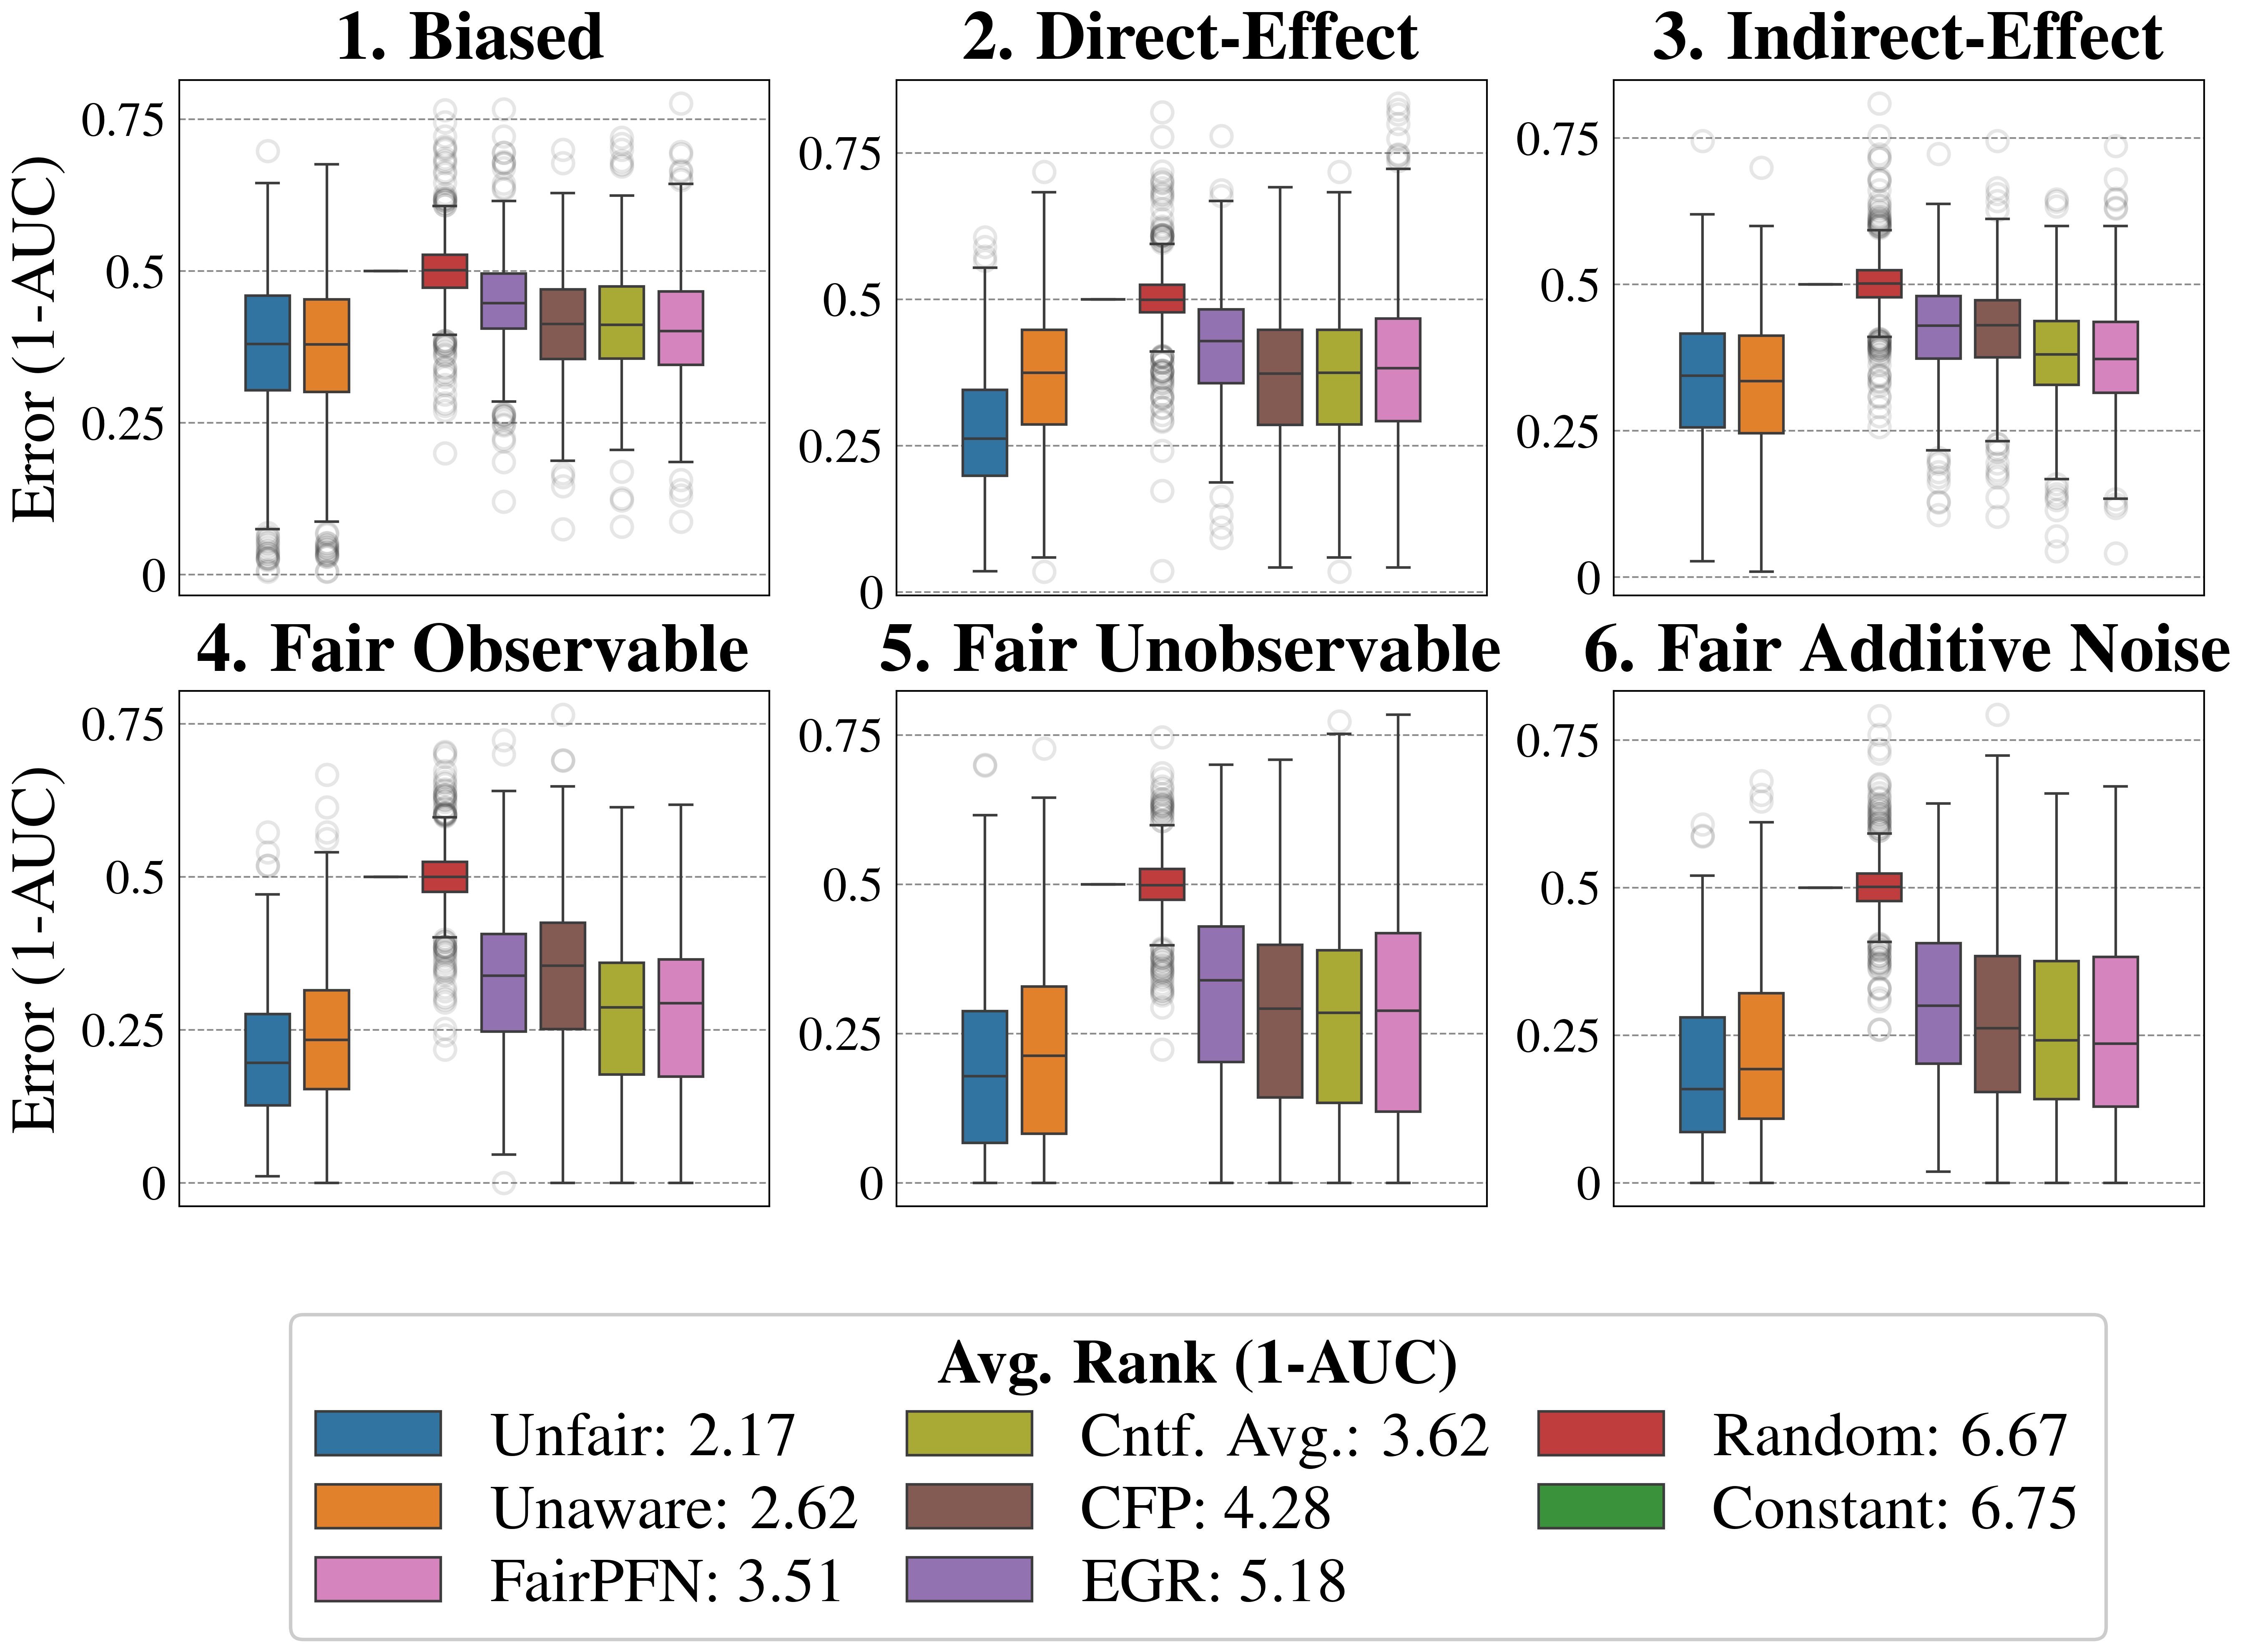
The image presents six box plots arranged in a 2x3 grid. Each box plot visualizes the distribution of "Error (1-AUC)" under different scenarios: "Biased", "Direct-Effect", "Indirect-Effect", "Fair Observable", "Fair Unobservable", and "Fair Additive Noise". The x-axis is categorical, representing different methods or models, while the y-axis represents the error rate, ranging from 0 to 0.75. A legend at the bottom indicates the average rank (1-AUC) for each method.
### Components/Axes
* **Y-axis:** "Error (1-AUC)", with ticks at 0, 0.25, 0.5, and 0.75.
* **X-axis:** Categorical, representing different methods/models. The order of the models is consistent across all six subplots.
* **Titles:** Each subplot has a title indicating the scenario: "1. Biased", "2. Direct-Effect", "3. Indirect-Effect", "4. Fair Observable", "5. Fair Unobservable", "6. Fair Additive Noise".
* **Legend:** Located at the bottom of the image, labeled "Avg. Rank (1-AUC)". It maps colors to methods and their average ranks:
* Blue: Unfair: 2.17
* Orange: Unaware: 2.62
* Pink: FairPFN: 3.51
* Olive Green: Cntf. Avg.: 3.62
* Brown: CFP: 4.28
* Purple: EGR: 5.18
* Red: Random: 6.67
* Green: Constant: 6.75
### Detailed Analysis
Each subplot contains box plots for the following methods (from left to right): Unfair, Unaware, FairPFN, Cntf. Avg., CFP, EGR, Random, and Constant.
**1. Biased:**
* Unfair: Median around 0.35, IQR between 0.25 and 0.45.
* Unaware: Median around 0.4, IQR between 0.3 and 0.5.
* FairPFN: Median around 0.4, IQR between 0.3 and 0.5.
* Cntf. Avg.: Median around 0.4, IQR between 0.3 and 0.5.
* CFP: Median around 0.45, IQR between 0.35 and 0.55.
* EGR: Median around 0.4, IQR between 0.3 and 0.5.
* Random: Median around 0.5, IQR between 0.4 and 0.6.
* Constant: Median around 0.7, IQR between 0.6 and 0.75.
**2. Direct-Effect:**
* Unfair: Median around 0.25, IQR between 0.15 and 0.35.
* Unaware: Median around 0.4, IQR between 0.3 and 0.5.
* FairPFN: Median around 0.4, IQR between 0.3 and 0.5.
* Cntf. Avg.: Median around 0.4, IQR between 0.3 and 0.5.
* CFP: Median around 0.4, IQR between 0.3 and 0.5.
* EGR: Median around 0.4, IQR between 0.3 and 0.5.
* Random: Median around 0.5, IQR between 0.4 and 0.6.
* Constant: Median around 0.5, IQR between 0.4 and 0.6.
**3. Indirect-Effect:**
* Unfair: Median around 0.35, IQR between 0.25 and 0.45.
* Unaware: Median around 0.4, IQR between 0.3 and 0.5.
* FairPFN: Median around 0.4, IQR between 0.3 and 0.5.
* Cntf. Avg.: Median around 0.4, IQR between 0.3 and 0.5.
* CFP: Median around 0.4, IQR between 0.3 and 0.5.
* EGR: Median around 0.4, IQR between 0.3 and 0.5.
* Random: Median around 0.5, IQR between 0.4 and 0.6.
* Constant: Median around 0.4, IQR between 0.3 and 0.5.
**4. Fair Observable:**
* Unfair: Median around 0.2, IQR between 0.1 and 0.3.
* Unaware: Median around 0.3, IQR between 0.2 and 0.4.
* FairPFN: Median around 0.4, IQR between 0.3 and 0.5.
* Cntf. Avg.: Median around 0.35, IQR between 0.25 and 0.45.
* CFP: Median around 0.4, IQR between 0.3 and 0.5.
* EGR: Median around 0.3, IQR between 0.2 and 0.4.
* Random: Median around 0.5, IQR between 0.4 and 0.6.
* Constant: Median around 0.4, IQR between 0.3 and 0.5.
**5. Fair Unobservable:**
* Unfair: Median around 0.25, IQR between 0.15 and 0.35.
* Unaware: Median around 0.35, IQR between 0.25 and 0.45.
* FairPFN: Median around 0.35, IQR between 0.25 and 0.45.
* Cntf. Avg.: Median around 0.35, IQR between 0.25 and 0.45.
* CFP: Median around 0.35, IQR between 0.25 and 0.45.
* EGR: Median around 0.35, IQR between 0.25 and 0.45.
* Random: Median around 0.5, IQR between 0.4 and 0.6.
* Constant: Median around 0.3, IQR between 0.2 and 0.4.
**6. Fair Additive Noise:**
* Unfair: Median around 0.2, IQR between 0.1 and 0.3.
* Unaware: Median around 0.3, IQR between 0.2 and 0.4.
* FairPFN: Median around 0.35, IQR between 0.25 and 0.45.
* Cntf. Avg.: Median around 0.35, IQR between 0.25 and 0.45.
* CFP: Median around 0.35, IQR between 0.25 and 0.45.
* EGR: Median around 0.35, IQR between 0.25 and 0.45.
* Random: Median around 0.5, IQR between 0.4 and 0.6.
* Constant: Median around 0.3, IQR between 0.2 and 0.4.
### Key Observations
* The "Random" and "Constant" methods consistently have higher error rates (1-AUC) across all scenarios.
* The "Unfair" method generally has lower error rates compared to "Unaware" in most scenarios.
* The "Fair" scenarios (4, 5, and 6) tend to have lower error rates overall compared to the "Biased" and "Effect" scenarios (1, 2, and 3).
* The average rank (1-AUC) in the legend correlates with the observed error rates in the box plots. Methods with lower average ranks (e.g., "Unfair") tend to have lower error rates.
### Interpretation
The box plots compare the performance of different methods in terms of error rate (1-AUC) under various fairness scenarios. The data suggests that explicitly addressing fairness concerns (as in the "Fair" scenarios) can lead to lower error rates compared to scenarios where bias is present or fairness is not considered. The "Random" and "Constant" methods, which likely represent baseline or naive approaches, consistently perform worse than the other methods. The relative performance of the "Unfair" and "Unaware" methods varies depending on the scenario, indicating that the impact of awareness of unfairness depends on the specific context. The average rank (1-AUC) provides a summary measure of the overall performance of each method across all scenarios, which aligns with the observed trends in the box plots.