TECHNICAL ASSET FINGERPRINT
198e5ba9f42a4eb767b9e83e
Click to view fullscreen
Press ESC or click to close
FOUND IN PAPERS
EXPERT: healer-alpha-free VERSION 1
RUNTIME: free/openrouter/healer-alpha
INTEL_VERIFIED
## Box Plot Comparison: Model Performance Across Fairness Scenarios
### Overview
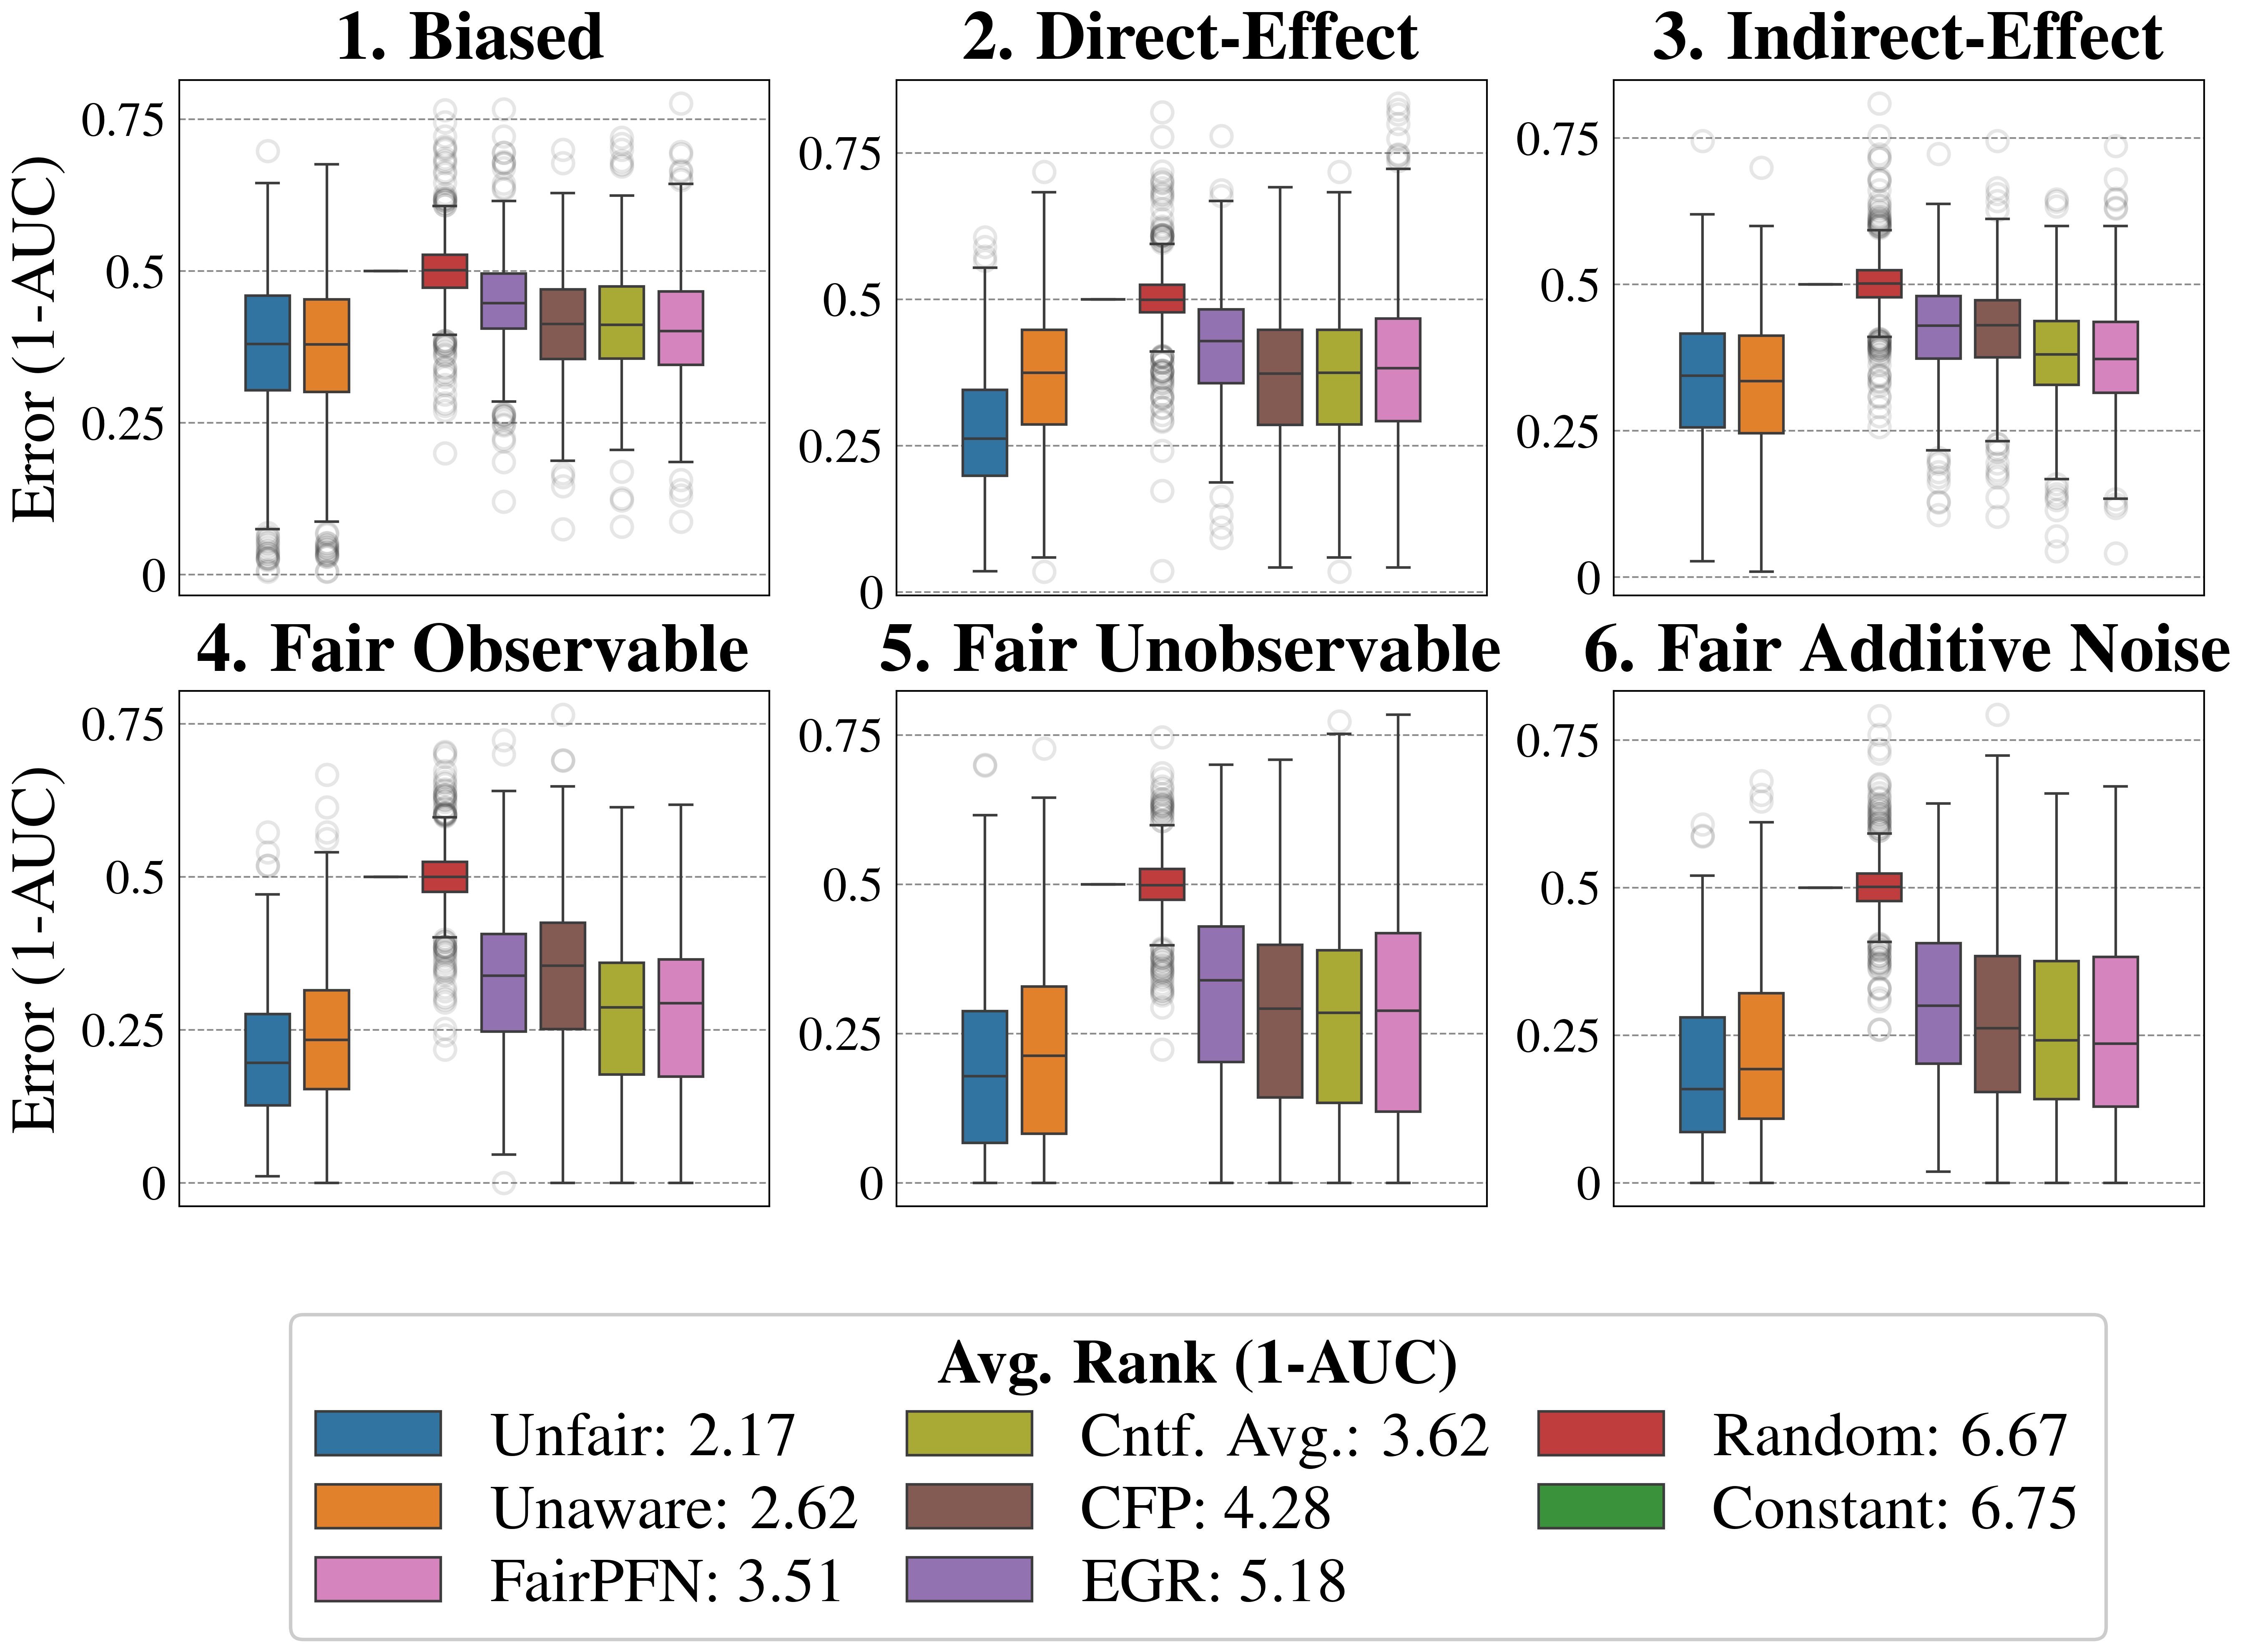
The image displays a 2x3 grid of six box plots, each comparing the performance of eight different machine learning models or methods across distinct data scenarios. Performance is measured by "Error (1-AUC)", where a lower value indicates better performance. A comprehensive legend at the bottom maps colors to method names and provides an overall average rank for each method.
### Components/Axes
* **Chart Type:** Six separate box plot charts arranged in a grid.
* **Y-Axis (All Charts):** Labeled **"Error (1-AUC)"**. The scale runs from 0.0 to 0.75, with major gridlines at 0.0, 0.25, 0.5, and 0.75.
* **Subplot Titles (Top of each chart):**
1. **Biased** (Top-Left)
2. **Direct-Effect** (Top-Center)
3. **Indirect-Effect** (Top-Right)
4. **Fair Observable** (Bottom-Left)
5. **Fair Unobservable** (Bottom-Center)
6. **Fair Additive Noise** (Bottom-Right)
* **Legend (Bottom Center):** A box containing color swatches and labels for eight methods, along with their "Avg. Rank (1-AUC)". Lower rank indicates better average performance.
* **Blue:** Unfair: 2.17
* **Orange:** Unaware: 2.62
* **Pink:** FairPFN: 3.51
* **Olive Green:** Cntf. Avg.: 3.62
* **Brown:** CFP: 4.28
* **Purple:** EGR: 5.18
* **Red:** Random: 6.67
* **Green:** Constant: 6.75
### Detailed Analysis
Each subplot contains eight box plots, one for each method listed in the legend. The box represents the interquartile range (IQR), the line inside is the median, whiskers extend to 1.5*IQR, and circles represent outliers.
**1. Biased (Top-Left):**
* **Unfair (Blue) & Unaware (Orange):** Lowest median error (~0.35-0.4). Similar distributions.
* **FairPFN (Pink), Cntf. Avg. (Olive), CFP (Brown), EGR (Purple):** Clustered with slightly higher median error (~0.4-0.45). FairPFN and Cntf. Avg. appear marginally better than CFP and EGR.
* **Random (Red):** Highest median error, centered at 0.5. Tight IQR.
* **Constant (Green):** Not visibly plotted in this chart (likely overlapping with Random or omitted).
**2. Direct-Effect (Top-Center):**
* **Unfair (Blue):** Lowest median error (~0.25).
* **Unaware (Orange):** Second lowest (~0.35).
* **FairPFN (Pink), Cntf. Avg. (Olive), CFP (Brown), EGR (Purple):** Medians range from ~0.35 to 0.45. FairPFN and Cntf. Avg. are on the lower end.
* **Random (Red):** Median at 0.5.
* **Constant (Green):** Not visibly plotted.
**3. Indirect-Effect (Top-Right):**
* **Unfair (Blue) & Unaware (Orange):** Very similar, lowest median error (~0.35).
* **FairPFN (Pink), Cntf. Avg. (Olive), CFP (Brown), EGR (Purple):** Medians between ~0.35 and 0.4. FairPFN and Cntf. Avg. are again slightly better.
* **Random (Red):** Median at 0.5.
* **Constant (Green):** Not visibly plotted.
**4. Fair Observable (Bottom-Left):**
* **Unfair (Blue):** Lowest median error (~0.2).
* **Unaware (Orange):** Second lowest (~0.25).
* **FairPFN (Pink), Cntf. Avg. (Olive), CFP (Brown), EGR (Purple):** Medians between ~0.25 and 0.35. FairPFN and Cntf. Avg. are lower than CFP and EGR.
* **Random (Red):** Median at 0.5.
* **Constant (Green):** Not visibly plotted.
**5. Fair Unobservable (Bottom-Center):**
* **Unfair (Blue):** Lowest median error (~0.2).
* **Unaware (Orange):** Second lowest (~0.25).
* **FairPFN (Pink), Cntf. Avg. (Olive), CFP (Brown), EGR (Purple):** Medians between ~0.25 and 0.35. FairPFN and Cntf. Avg. are lower.
* **Random (Red):** Median at 0.5.
* **Constant (Green):** Not visibly plotted.
**6. Fair Additive Noise (Bottom-Right):**
* **Unfair (Blue):** Lowest median error (~0.15).
* **Unaware (Orange):** Second lowest (~0.2).
* **FairPFN (Pink), Cntf. Avg. (Olive), CFP (Brown), EGR (Purple):** Medians between ~0.2 and 0.3. FairPFN and Cntf. Avg. are lower.
* **Random (Red):** Median at 0.5.
* **Constant (Green):** Not visibly plotted.
### Key Observations
1. **Consistent Hierarchy:** Across all six scenarios, the performance order is remarkably consistent: **Unfair** (best) > **Unaware** > **FairPFN** ≈ **Cntf. Avg.** > **CFP** ≈ **EGR** > **Random** (worst). The **Constant** method is listed in the legend but does not appear as a distinct box plot in any chart, suggesting its performance may be identical to or obscured by the Random baseline (median=0.5).
2. **Scenario Impact:** The absolute error values are lowest in the "Fair" scenarios (4, 5, 6), particularly "Fair Additive Noise," where the best models achieve medians below 0.2. The "Biased" scenario shows the highest overall error levels.
3. **Baseline Performance:** The **Random** method consistently has a median error of 0.5, which is the expected performance of random guessing for AUC (since AUC=0.5 implies no discriminative ability, making 1-AUC=0.5).
4. **Fairness-Accuracy Trade-off:** Methods designed for fairness (FairPFN, Cntf. Avg., CFP, EGR) consistently incur a higher error (lower AUC) than the "Unfair" and "Unaware" baselines, illustrating the typical trade-off between fairness and predictive performance.
### Interpretation
This visualization provides a clear empirical comparison of model performance under different data-generating processes related to fairness. The key takeaway is that **ignoring fairness constraints ("Unfair" and "Unaware" models) yields the best predictive performance (lowest 1-AUC) across all tested scenarios.** However, this comes at the potential cost of fairness.
The fairness-aware methods (FairPFN, Cntf. Avg., CFP, EGR) successfully reduce error compared to the naive random baseline but cannot match the performance of models not constrained by fairness. Among these, **FairPFN and Counterfactual Averaging (Cntf. Avg.) consistently outperform Counterfactual Fairness Prediction (CFP) and Equalized Odds Post-processing (EGR)**, suggesting they may be more effective at balancing fairness and accuracy in these contexts.
The fact that the "Constant" model (which likely predicts a single constant value) performs identically to "Random" (median error 0.5) indicates that in these binary classification tasks, a trivial constant predictor is no better than random chance. The progression from "Biased" to the "Fair" scenarios shows that when the underlying data structure is fairer, all models, including the fairness-aware ones, achieve lower absolute error rates.
DECODING INTELLIGENCE...