## Box Plot Chart: Error (1-AUC) Across Scenarios and Methods
### Overview
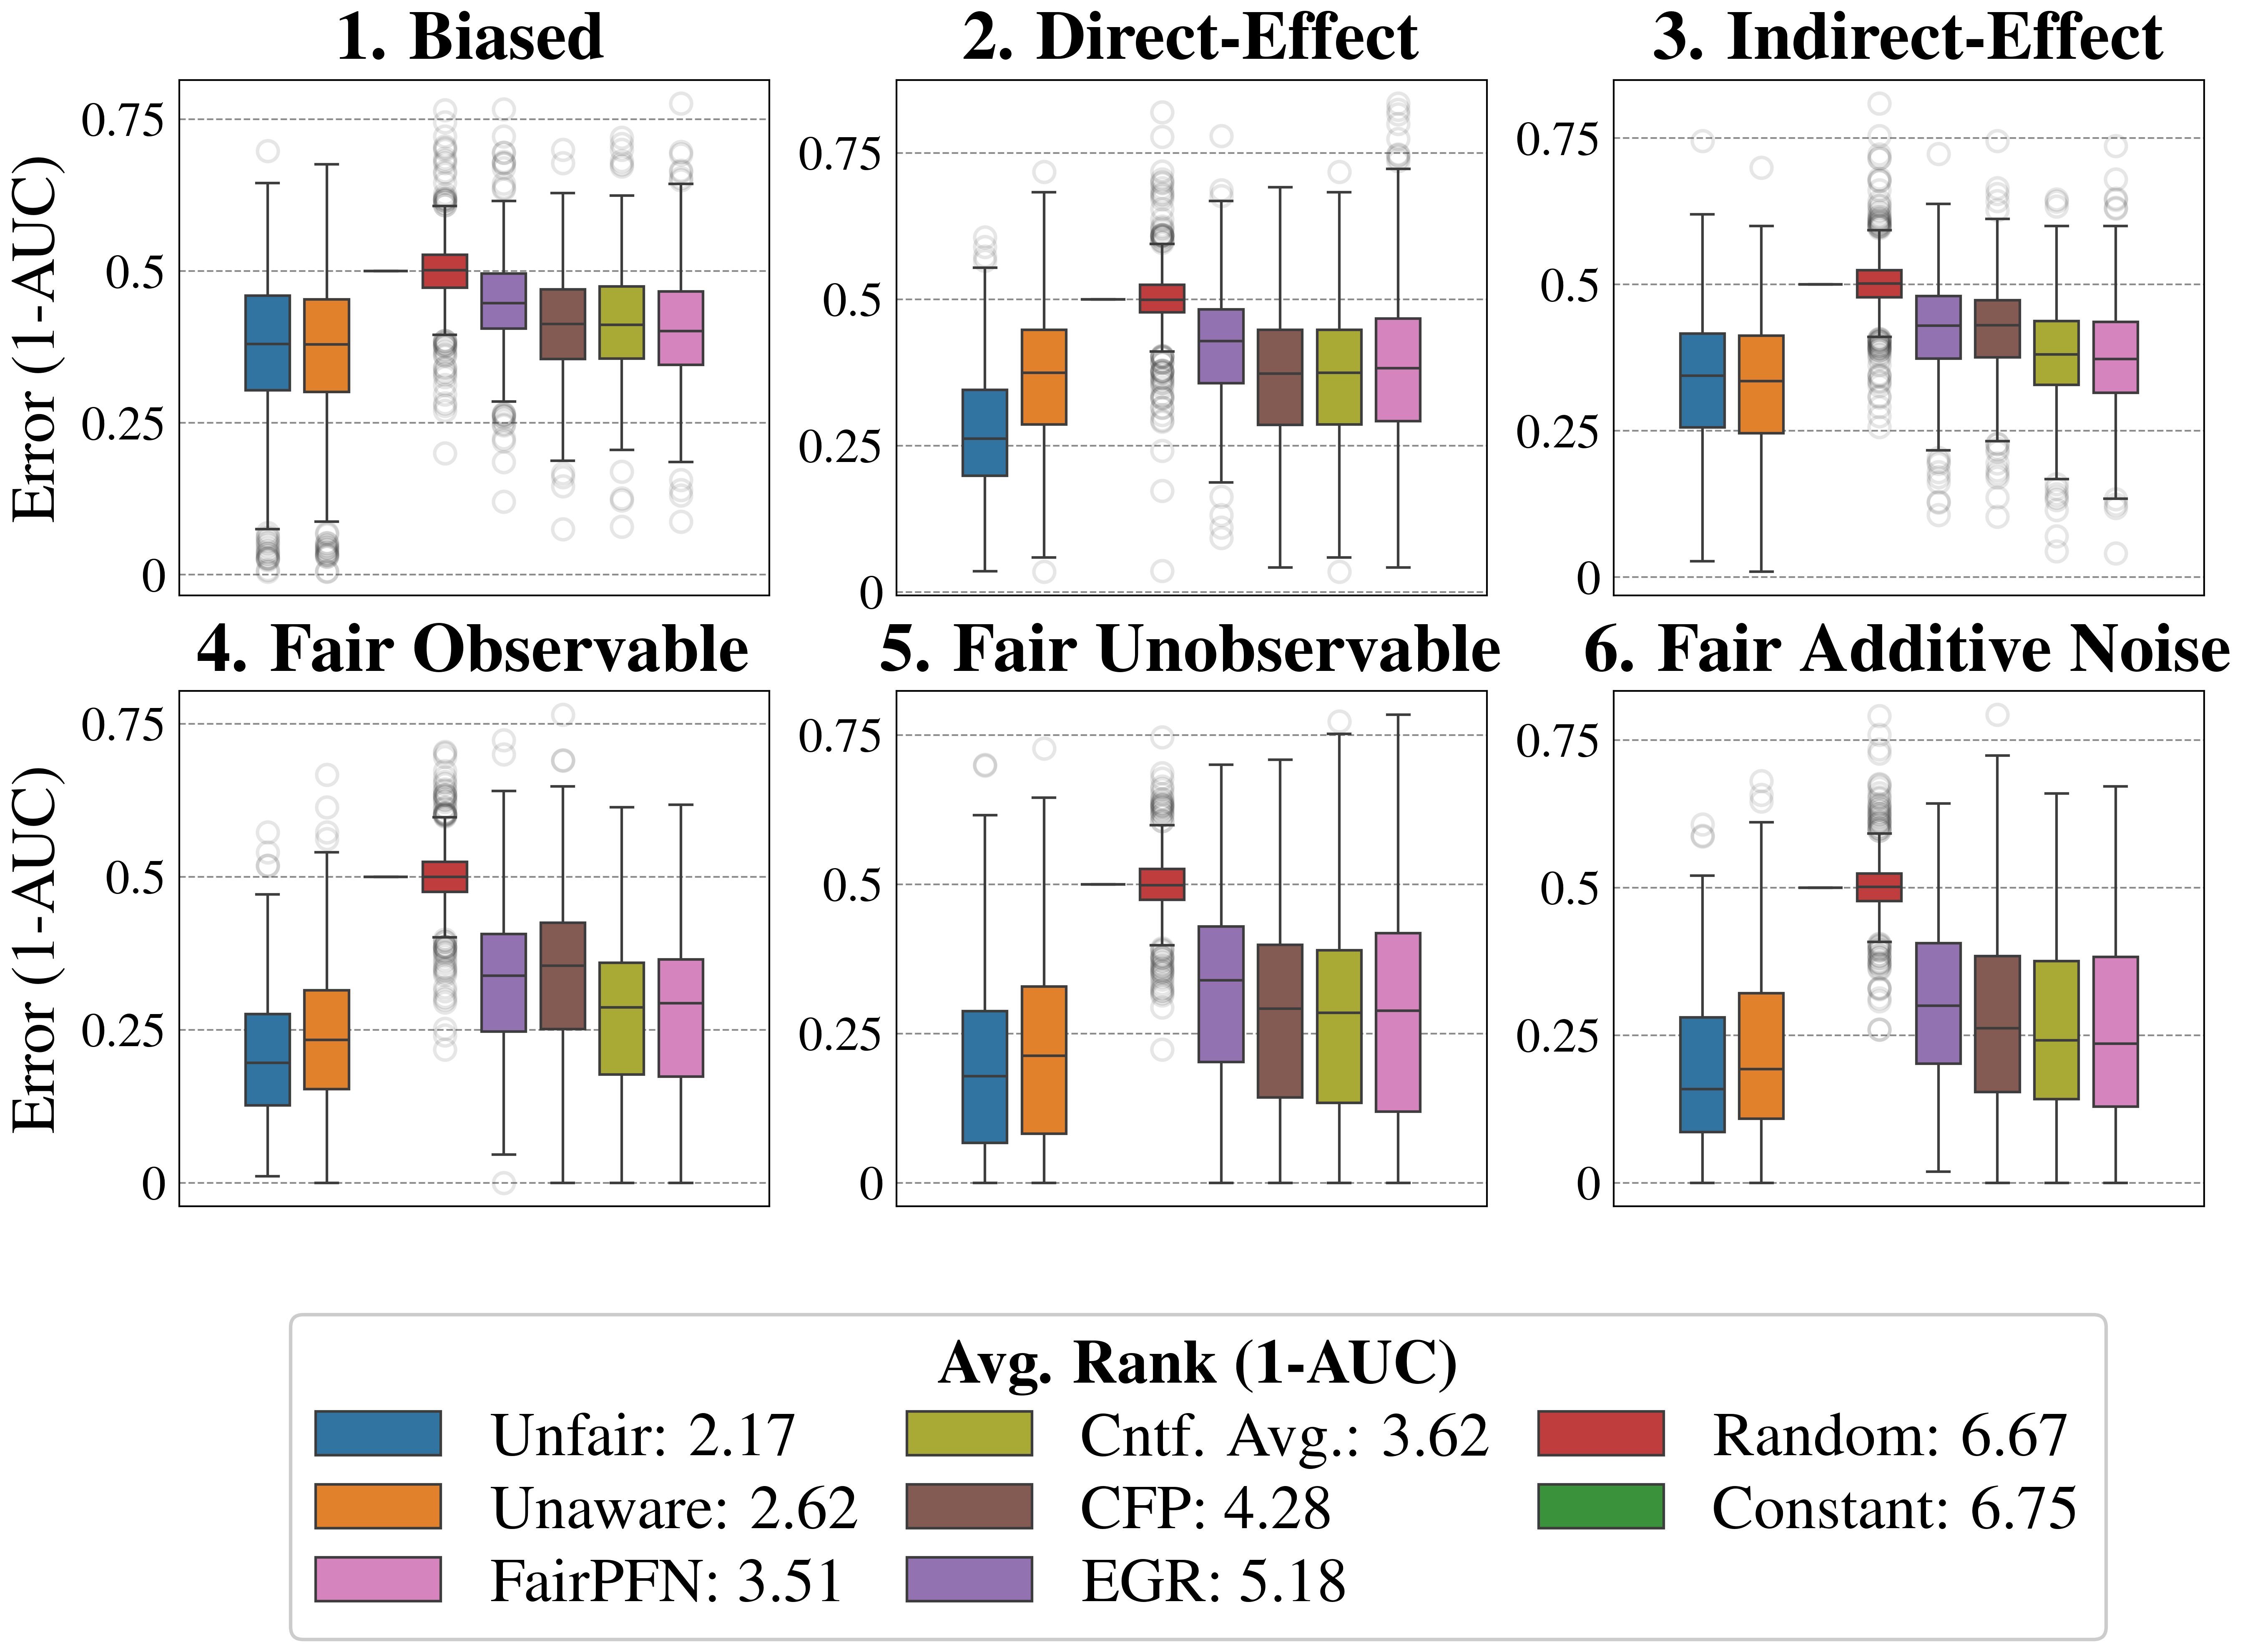
The image displays six box plots arranged in a 2x3 grid, comparing the error rates (1-AUC) of different fairness-aware machine learning methods across six scenarios: Biased, Direct-Effect, Indirect-Effect, Fair Observable, Fair Unobservable, and Fair Additive Noise. Each box plot represents a method's performance distribution, with colors corresponding to specific methods and their average ranks.
### Components/Axes
- **Y-Axis**: "Error (1-AUC)" (range: 0 to 0.75)
- **X-Axis**: Six scenarios (labeled 1–6 with descriptive titles)
- **Legend**: Located at the bottom, mapping colors to methods and their average ranks:
- **Blue**: Unfair (Avg. Rank: 2.17)
- **Orange**: Unaware (Avg. Rank: 2.62)
- **Purple**: FairPFN (Avg. Rank: 3.51)
- **Brown**: Cntf. Avg. (Avg. Rank: 3.62)
- **Red**: Random (Avg. Rank: 6.67)
- **Green**: Constant (Avg. Rank: 6.75)
### Detailed Analysis
1. **Biased (1)**:
- **Unfair (blue)**: Lowest median error (~0.3), narrowest interquartile range.
- **Unaware (orange)**: Slightly higher median (~0.4), wider spread.
- **FairPFN (purple)**: Median ~0.45, moderate spread.
- **Cntf. Avg. (brown)**: Median ~0.5, similar spread to FairPFN.
- **Random (red)**: Highest median (~0.55), large spread.
- **Constant (green)**: Median ~0.6, widest spread.
2. **Direct-Effect (2)**:
- **Unfair (blue)**: Lowest median (~0.3), tightest distribution.
- **Unaware (orange)**: Median ~0.4, moderate spread.
- **FairPFN (purple)**: Median ~0.45, similar to Cntf. Avg. (brown).
- **Random (red)**: Median ~0.5, large spread.
- **Constant (green)**: Median ~0.6, widest spread.
3. **Indirect-Effect (3)**:
- **Unfair (blue)**: Lowest median (~0.3), narrowest range.
- **Unaware (orange)**: Median ~0.4, moderate spread.
- **FairPFN (purple)**: Median ~0.45, similar to Cntf. Avg. (brown).
- **Random (red)**: Median ~0.5, large spread.
- **Constant (green)**: Median ~0.6, widest spread.
4. **Fair Observable (4)**:
- **Unfair (blue)**: Lowest median (~0.3), tightest distribution.
- **Unaware (orange)**: Median ~0.4, moderate spread.
- **FairPFN (purple)**: Median ~0.45, similar to Cntf. Avg. (brown).
- **Random (red)**: Median ~0.5, large spread.
- **Constant (green)**: Median ~0.6, widest spread.
5. **Fair Unobservable (5)**:
- **Unfair (blue)**: Lowest median (~0.3), tightest distribution.
- **Unaware (orange)**: Median ~0.4, moderate spread.
- **FairPFN (purple)**: Median ~0.45, similar to Cntf. Avg. (brown).
- **Random (red)**: Median ~0.5, large spread.
- **Constant (green)**: Median ~0.6, widest spread.
6. **Fair Additive Noise (6)**:
- **Unfair (blue)**: Lowest median (~0.3), narrowest range.
- **Unaware (orange)**: Median ~0.4, moderate spread.
- **FairPFN (purple)**: Median ~0.45, similar to Cntf. Avg. (brown).
- **Random (red)**: Median ~0.5, large spread.
- **Constant (green)**: Median ~0.6, widest spread.
### Key Observations
- **Unfair (blue)** consistently shows the lowest error rates (1-AUC) across all scenarios, with the tightest distributions.
- **Unaware (orange)** performs second-best, with slightly higher medians and wider spreads than Unfair.
- **FairPFN (purple)** and **Cntf. Avg. (brown)** have overlapping medians (~0.45) but FairPFN has slightly tighter distributions.
- **Random (red)** and **Constant (green)** exhibit the highest errors, with Constant showing the widest spread (indicating high variability).
### Interpretation
The data suggests that **Unfair** and **Unaware** methods outperform fairness-aware approaches (FairPFN, Cntf. Avg.) in terms of error rates (1-AUC) across all scenarios. This implies that fairness-aware methods may introduce trade-offs between fairness and accuracy. The **Random** and **Constant** methods perform worst, with Constant showing the highest variability (widest spreads). The average ranks confirm this hierarchy: Unfair (2.17) and Unaware (2.62) rank highest (best performance), while Constant (6.75) ranks lowest. The consistent pattern across scenarios indicates that fairness constraints may not always align with optimal predictive performance.