## Flowchart: Node-Based System Architecture
### Overview
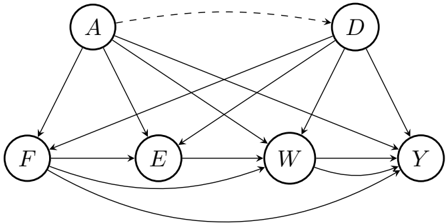
The image depicts a directed graph (flowchart) with six nodes labeled A, D, F, E, W, and Y. Arrows indicate directional relationships between nodes, with one dashed arrow (A→D) and multiple solid arrows. The structure suggests a network of interconnected processes or entities.
### Components/Axes
- **Nodes**:
- A (top-left)
- D (top-right)
- F (bottom-left)
- E (center-left)
- W (center-right)
- Y (bottom-right)
- **Arrows**:
- Solid arrows represent standard directional relationships.
- Dashed arrow (A→D) indicates a distinct or weaker connection.
- **Self-loop**: Node Y has a circular arrow, suggesting a feedback or recursive process.
### Detailed Analysis
1. **Node A**:
- Connects to F, E, W, Y (solid arrows).
- Has a dashed arrow to D, implying a non-standard or optional relationship.
2. **Node D**:
- Receives input from A (dashed) and connects to W and Y (solid).
3. **Node F**:
- Connects to E and W (solid arrows).
4. **Node E**:
- Receives input from F and A, connects to W.
5. **Node W**:
- Central hub: Receives input from A, F, E, and D; connects to Y.
6. **Node Y**:
- Receives input from A, D, W.
- Self-loop (Y→Y) indicates a recursive or cyclical process.
### Key Observations
- **Central Hub**: Node W acts as a convergence point for multiple inputs (A, F, E, D) and outputs to Y.
- **Dashed Connection**: The A→D relationship is visually distinct, possibly denoting a weaker, optional, or indirect link.
- **Feedback Loop**: Y’s self-loop suggests a process that reinforces itself or requires iterative evaluation.
- **Asymmetry**: Node A has the most outgoing connections, while Y has the most incoming (including its self-loop).
### Interpretation
This flowchart likely represents a system where:
- **A** is a primary initiator or source, distributing influence to multiple nodes (F, E, W, Y) and weakly to D.
- **W** serves as a critical intermediary, aggregating inputs and directing output to Y.
- **Y**’s self-loop implies a process requiring continuous feedback (e.g., validation, iteration, or stabilization).
- The dashed A→D arrow may represent an exception, contingency, or secondary pathway in the system.
The structure emphasizes redundancy (multiple paths to W/Y) and resilience, with potential vulnerabilities at the central hub (W). The dashed arrow introduces ambiguity, suggesting the need for further clarification on its role (e.g., error handling, alternative routing).