\n
## Diagram: Directed Acyclic Graph
### Overview
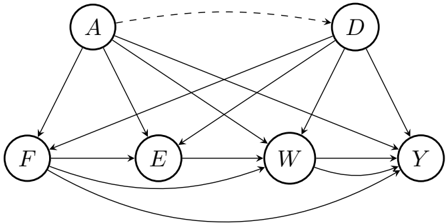
The image depicts a directed acyclic graph (DAG) consisting of seven nodes labeled A through Y. The nodes are connected by directed edges, indicating a flow or dependency relationship between them. The graph does not contain any cycles.
### Components/Axes
The diagram consists of the following nodes: A, F, E, W, D, and Y.
The edges represent directed relationships between the nodes. One edge is dashed.
### Detailed Analysis or Content Details
The following relationships are depicted:
* A -> F
* A -> E
* A -> D
* A -> W
* F -> E
* F -> W
* E -> W
* E -> Y
* W -> Y
* D -> Y
* D -> W
* A --(dashed)--> D
### Key Observations
The graph is relatively dense, with several nodes having multiple outgoing edges. Node A appears to be a central starting point, influencing multiple other nodes. Node Y is a terminal node, receiving input from D, E, and W. The dashed line from A to D suggests a potentially different or weaker relationship compared to the solid lines.
### Interpretation
This diagram likely represents a causal model, a workflow, or a dependency structure. The nodes could represent tasks, variables, or events, and the edges represent the order in which they must occur or the influence one has on another. The dashed line from A to D could indicate a conditional dependency or a less direct influence. The graph suggests that to reach Y, one must go through D, E, or W, and that A is a key driver of the system. The absence of cycles indicates that the process is not recursive or self-referential. Without further context, it's difficult to determine the specific meaning of the nodes and edges, but the structure provides a clear visual representation of the relationships between them.