## Directed Graph Diagram: Node and Edge Structure
### Overview
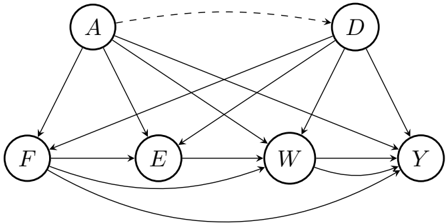
The image displays a directed graph (digraph) consisting of six nodes, each represented by a circle containing a single uppercase letter. The nodes are interconnected by directed edges (arrows), indicating one-way relationships or flows. One edge is dashed, while all others are solid.
### Components
* **Nodes (Vertices):** Six circular nodes, each labeled with a single letter:
* **A** (Top-left)
* **D** (Top-right)
* **F** (Bottom-left)
* **E** (Bottom-center-left)
* **W** (Bottom-center-right)
* **Y** (Bottom-right)
* **Edges (Directed Connections):** Arrows indicating direction from a source node to a target node.
* **Dashed Edge:** One edge from node **A** to node **D**.
* **Solid Edges:** All other edges are solid lines with arrowheads.
### Detailed Analysis
**Node Positions and Connections:**
1. **Node A (Top-left):**
* **Outgoing Edges (5):**
* To **D** (dashed line, top horizontal path).
* To **F** (solid line, downward-left diagonal).
* To **E** (solid line, downward diagonal).
* To **W** (solid line, downward-right diagonal).
* To **Y** (solid line, long downward-right diagonal).
* **Incoming Edges:** None.
2. **Node D (Top-right):**
* **Outgoing Edges (4):**
* To **F** (solid line, long downward-left diagonal).
* To **E** (solid line, downward-left diagonal).
* To **W** (solid line, downward diagonal).
* To **Y** (solid line, downward-right diagonal).
* **Incoming Edges (1):**
* From **A** (dashed line).
3. **Node F (Bottom-left):**
* **Outgoing Edges (3):**
* To **E** (solid line, rightward horizontal).
* To **W** (solid line, rightward diagonal).
* To **Y** (solid line, long rightward diagonal along the bottom).
* **Incoming Edges (2):**
* From **A**.
* From **D**.
4. **Node E (Bottom-center-left):**
* **Outgoing Edges (2):**
* To **W** (solid line, rightward horizontal).
* To **Y** (solid line, rightward diagonal).
* **Incoming Edges (3):**
* From **A**.
* From **D**.
* From **F**.
5. **Node W (Bottom-center-right):**
* **Outgoing Edges (1):**
* To **Y** (solid line, rightward horizontal).
* **Incoming Edges (4):**
* From **A**.
* From **D**.
* From **F**.
* From **E**.
6. **Node Y (Bottom-right):**
* **Outgoing Edges:** None.
* **Incoming Edges (5):**
* From **A**.
* From **D**.
* From **F**.
* From **E**.
* From **W**.
### Key Observations
1. **Source and Sink Nodes:** Node **A** is a pure source (only outgoing edges). Node **Y** is a pure sink (only incoming edges).
2. **Dashed Line Significance:** The single dashed edge from **A** to **D** is visually distinct from all other solid edges, suggesting a different type of relationship (e.g., optional, conditional, or a different category of dependency).
3. **Connectivity Density:** The lower row of nodes (F, E, W, Y) forms a densely connected subgraph where each node connects to all nodes to its right. Node **W** and **Y** have the highest in-degree (4 and 5 incoming edges, respectively).
4. **Hierarchical Flow:** There is a general top-to-bottom and left-to-right flow of connections, with the top nodes (A, D) feeding into the lower chain.
### Interpretation
This diagram represents a system of dependencies or a workflow. Nodes **A** and **D** act as primary initiators or input sources. The dashed line between them may indicate that **D**'s activation or state is dependent on **A** in a non-standard way compared to the solid-line dependencies.
The lower nodes (F, E, W, Y) appear to be processing stages or components that receive inputs from the sources and from each other in a sequential, left-to-right manner. The final node, **Y**, is the ultimate destination or output, aggregating influences from all other nodes in the system.
The graph structure suggests a model where:
* **A** has the broadest direct influence, connecting to every other node.
* **Y** is the most influenced component, receiving direct input from all others.
* The connections between F, E, W, and Y imply a pipeline or chain where each stage can pass information forward.
Without additional context, this could model anything from a software module dependency graph, a causal network in a study, a process flow in manufacturing, or a decision tree in an organizational structure. The key takeaway is the directional flow of influence from the top-left source (**A**) towards the bottom-right sink (**Y**), with **D** serving as a secondary, possibly conditional, source.