## 3D Scatter Plot: Channel Value Distribution Across Tokens and Latent Channels
### Overview
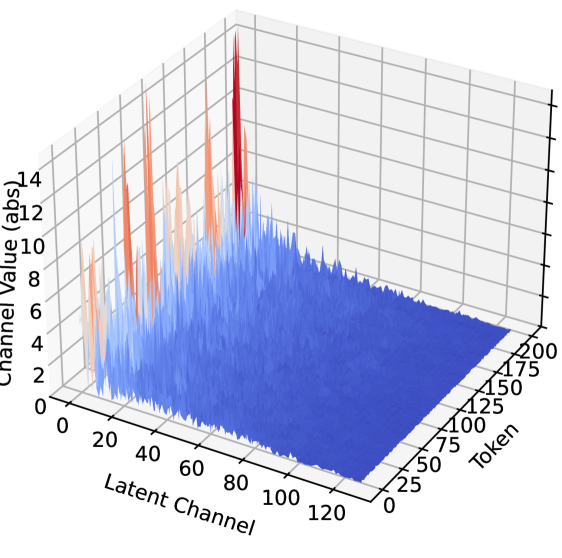
The image depicts a 3D scatter plot visualizing the distribution of "Channel Value (abs)" across two dimensions: "Token" (0–200) and "Latent Channel" (0–120). The plot uses color-coded data points to represent varying magnitudes of Channel Value, with a legend in the top-left corner indicating three categories: blue (low values), orange (medium values), and red (high values).
---
### Components/Axes
- **X-axis (Token)**: Ranges from 0 to 200, labeled "Token."
- **Y-axis (Latent Channel)**: Ranges from 0 to 120, labeled "Latent Channel."
- **Z-axis (Channel Value)**: Ranges from 0 to 14, labeled "Channel Value (abs)."
- **Legend**: Located in the top-left corner, with three color categories:
- **Blue**: Low Channel Values (0–4 abs).
- **Orange**: Medium Channel Values (5–10 abs).
- **Red**: High Channel Values (11–14 abs).
---
### Detailed Analysis
1. **Blue Data Points**:
- Dominant across the entire plot, forming a dense, flat layer.
- Concentrated in the lower Z-axis range (0–4 abs).
- Spread uniformly across all Token and Latent Channel values.
2. **Orange Data Points**:
- Sparse and scattered, primarily in the mid-range of the Z-axis (5–10 abs).
- Clustered near Token ≈ 50–100 and Latent Channel ≈ 20–60.
3. **Red Data Points**:
- Extremely sparse, forming isolated peaks.
- Located near Token ≈ 0–20 and Latent Channel ≈ 0–10.
- Channel Values reach the maximum observed value of **14 abs**.
---
### Key Observations
- **Outliers**: Red points represent extreme values, deviating significantly from the majority (blue) distribution.
- **Clustering**: Blue points dominate the lower Z-axis, suggesting most Channel Values are low-magnitude.
- **Intermediate Values**: Orange points indicate a small subset of medium-magnitude values, concentrated in specific Token/Latent Channel regions.
- **Spatial Distribution**: High values (red) are tightly grouped near the origin (Token ≈ 0, Latent Channel ≈ 0), while medium values (orange) are dispersed further out.
---
### Interpretation
The plot suggests a hierarchical structure in the data:
1. **Majority Behavior**: Most tokens and latent channels exhibit low Channel Values (blue), indicating a baseline or default