## Line Chart: Attention Key Query Score, a=256
### Overview
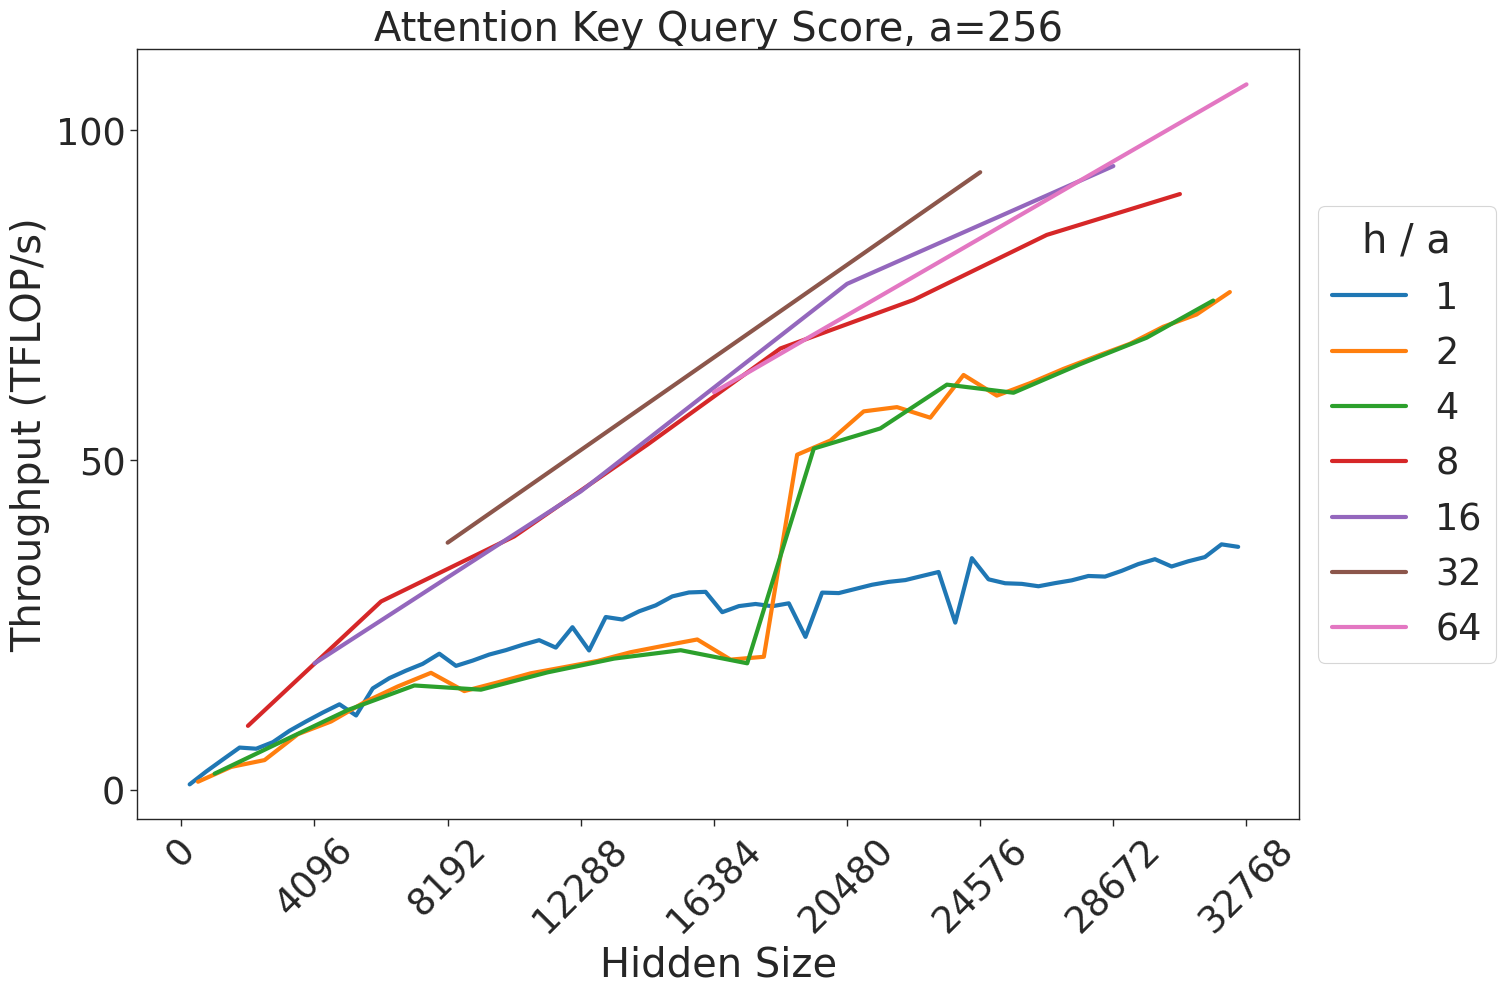
This chart illustrates the relationship between "Hidden Size" (x-axis) and "Throughput (TFLOP/s)" (y-axis) for various "h / a" ratios. The chart demonstrates how computational throughput scales as the hidden size increases, with distinct performance profiles based on the "h / a" parameter.
### Components/Axes
* **Title:** Attention Key Query Score, a=256
* **X-Axis:** "Hidden Size". The scale ranges from 0 to 32768. Markers are provided at intervals of 4096 (0, 4096, 8192, 12288, 16384, 20480, 24576, 28672, 32768).
* **Y-Axis:** "Throughput (TFLOP/s)". The scale ranges from 0 to 100+.
* **Legend:** Located on the right side of the chart. It defines the "h / a" ratio, with seven distinct series represented by colors:
* Blue: 1
* Orange: 2
* Green: 4
* Red: 8
* Purple: 16
* Brown: 32
* Pink: 64
### Detailed Analysis
The chart displays seven data series. Below is the trend verification and approximate data extraction for each:
* **Blue (h/a=1):**
* *Trend:* Slopes upward steadily but remains the lowest performing series throughout the entire range.
* *Data:* Starts at (0,0), reaches ~20 TFLOP/s at 12288, and ends at ~35 TFLOP/s at 32768.
* **Orange (h/a=2) & Green (h/a=4):**
* *Trend:* These two lines are almost perfectly overlapping. They exhibit a slow, steady upward trend until a hidden size of ~16384, at which point there is a **massive, near-vertical discontinuity (jump)** in throughput, followed by a continued upward trend.
* *Data:* Starts at (0,0). At 16384, throughput is ~20 TFLOP/s. Immediately after, it jumps to ~50 TFLOP/s. It ends at ~70 TFLOP/s at 32768.
* **Red (h/a=8):**
* *Trend:* Slopes upward consistently.
* *Data:* Starts at ~10 TFLOP/s (at ~2048), reaches ~50 TFLOP/s at 16384, and ends at ~85 TFLOP/s at 28672.
* **Purple (h/a=16):**
* *Trend:* Slopes upward consistently, slightly steeper than the Red line.
* *Data:* Starts at ~10 TFLOP/s (at ~2048), reaches ~60 TFLOP/s at 16384, and ends at ~95 TFLOP/s at 24576.
* **Brown (h/a=32):**
* *Trend:* Slopes upward consistently. This series is truncated; it does not start at 0 and does not reach the maximum x-axis value.
* *Data:* Starts at ~40 TFLOP/s (at ~8192) and ends at ~95 TFLOP/s (at ~24576).
* **Pink (h/a=64):**
* *Trend:* The steepest upward slope, representing the highest throughput.
* *Data:* Starts at ~10 TFLOP/s (at ~2048), reaches ~70 TFLOP/s at 16384, and ends at ~110 TFLOP/s at 32768.
### Key Observations
* **Performance Correlation:** There is a clear positive correlation between the "h / a" ratio and throughput. Higher ratios consistently yield higher TFLOP/s.
* **The Discontinuity Anomaly:** The most notable feature is the sharp vertical jump in the Orange (2) and Green (4) lines between 16384 and 20480. This suggests a change in the underlying computational kernel, memory tiling strategy, or algorithm execution path that suddenly becomes much more efficient at larger hidden sizes.
* **Truncation:** The Brown (32) series is incomplete compared to the others, suggesting that the specific configuration or hardware limitations prevented data collection for this ratio at the lower and higher ends of the hidden size spectrum.
### Interpretation
This chart is likely a performance benchmark for an attention mechanism implementation (such as FlashAttention) on a GPU.
* **Kernel Switching:** The discontinuity in the Orange and Green lines strongly implies that the software implementation switches to a more optimized kernel or tiling strategy once the hidden size exceeds 16384.
* **Efficiency Scaling:** The fact that higher "h / a" ratios (like 64) achieve higher throughput suggests that the implementation is better optimized for larger head counts or specific memory access patterns associated with those ratios.
* **Hardware/Software Limits:** The truncation of the Brown line and the varying start/end points of the lines suggest that certain configurations are only valid or performant within specific "Hidden Size" ranges, likely due to memory constraints (VRAM) or kernel compatibility.